advertiment. lʼaccés als continguts dʼaquesta tesi queda ...cariño, por sacar siempre un...
TRANSCRIPT
ADVERTIMENT. Lʼaccés als continguts dʼaquesta tesi queda condicionat a lʼacceptació de les condicions dʼúsestablertes per la següent llicència Creative Commons: http://cat.creativecommons.org/?page_id=184
ADVERTENCIA. El acceso a los contenidos de esta tesis queda condicionado a la aceptación de las condiciones de usoestablecidas por la siguiente licencia Creative Commons: http://es.creativecommons.org/blog/licencias/
WARNING. The access to the contents of this doctoral thesis it is limited to the acceptance of the use conditions setby the following Creative Commons license: https://creativecommons.org/licenses/?lang=en

The role of landscape and species attributes in insect community
assembly, population genetics and plant-insect interactions in expanding
Quercus ilex forests
PhD Thesis
Helena Ruiz Carbayo
With the approval of the supervisors
Dr. Joan Pino Vilalta Dr. Josep Maria Espelta Morral Dr. Raúl Bonal Andrés
PhD in Terrestrial Ecology
Ecological and Forestry Applications Research Centre (CREAF)
Autonomous University of Barcelona (UAB)
May 2018


A mis padres.


Agradecimientos
Y por fin llega el momento de decir: ¡TESIS ACABADA!
Cuando supe que iba a trabajar como doctoranda, se me vinieron a la mente todos aquellos
comentarios de compañeros que ya estaban con la camisa remangada y en plena faena: que si
directores que no ejercen como tal por aquí, experimentos que no quieren salir bien por allá,
crisis existenciales a la orden del día… ¿de verdad quería experimentar todo aquello? Pero
tenía 26 añitos y me veía con fuerzas; después de todo había elegido ser bióloga y quería
comprobar de manera empírica en qué consistía eso de “hacer una tesis”. Y si algo he
aprendido en estos cuatro años es que las cosas hay que vivirlas por uno mismo, porque como
decía Ortega y Gasset “Yo soy yo y mi circunstancia”, y el CREAF, sin duda, ha sido la mejor
circunstancia posible para mi formación como doctora. A día de hoy estoy segura de que tomé
la decisión acertada.
Quisiera agradecer en primer lugar, como no, a mis tres directores, Joan Pino, Josep María
Espelta y Raúl Bonal, por haberme dado la oportunidad de participar en este proyecto. Gracias
también por haber cumplido con sus obligaciones como directores de manera impecable,
demostrando siempre una buena sintonía entre ellos y una gran disposición a ayudarme
siempre que lo he necesitado. Gracias a Joan por ejercer de padre de tesis, por su
pragmatismo y sus amplios conocimientos en SIG que me han sacado del “atolladero” en más
de una ocasión. A Tete por ser “el poli malo” y apretarme las tuercas, pero siempre desde el
cariño, por sacar siempre un huequito para mis dudas y ayudarme a ver la luz al final de
túneles que realmente no lo eran; y a Raúl por ser un brainstorm andante, siempre con
sugerencias interesantes y nuevos softwares que probar, y por su fantástica energía con la que
contagia su entusiasmo a todo aquel que se cruza en su camino.
Gracias absolutamente a mi familia, que es mi pilar básico y mi fuente de alegría. Gracias por
ser una familia tan unida y ayudarme a recargar las pilas cada vez que he vuelto a casa. Gracias
en especial a mi abuela, padres y hermana, por sus comidas caseras reconstituyentes, sus
sabios consejos y su amor incondicional.
Gracias también a mi colla de Cerdanyola, por aceptarme como una más desde el principio;
por tantos findes de calçotadas y excursiones, tardes de paseos y helados, noches de cine y
diversión. Merecen una mención especial Núria y Diana, por ser tan acogedoras y estar
dispuestas a ayudarme en todo lo que fuera necesario ya desde el primer día; mi director
favorito (no de tesis, sino de cortometrajes) Pedro Celma, que ha ejercido de consejero y guía
espiritual en innumerables ocasiones; y sobre todo mi gran amiga Raquel, mi virtuosa del
ArcGIS y mi flower, con un power capaz de iluminar a cualquiera y una sabiduría y paz
interiores que ni el mismísimo Dalái Lama.
Todos y cada uno de ellos han aportado su granito de arena para que esta etapa de mi vida, la
haya afrontado con determinación y alegría, pero si hay alguien a quien quiero dedicar el
grueso de estos agradecimientos ese es sin duda mi grupo de compañeros y amigos del CREAF.
¡Cuánto he aprendido de vosotros!
De la sección más radical, Marcos Fernández, Guillem Bagaria y Víctor Granda, he aprendido
que con R puedes hacer casi de todo, ¡hasta felicitaciones de navidad! El camino hacia la
victoria pasa por tener el código adecuado y ellos saben perfectamente dónde encontrarlo. De
naturaleza noble, ofrecen su ayuda sin pedir nada a cambio, aunque, si la cosa se tercia,
también aceptarán cervezas y snacks varios como moneda de cambio.
De la sección naturalista, Marcos Fernández, Guillem Bagaria, Ferran Sayol y Xavi Domene, he
aprendido que Cataluña tiene infinidad de rincones por descubrir. Gracias a sus excursiones
organizadas, estos cuatro años culminan con un conocimiento profundo de los paisajes de la
plana de Vic y del Maresme, además de algunas de sus costumbres más arraigadas, como los
portafardells de Mataró o la plantada del árbol de mayo en Folgueroles. ¡Esta gente sí que
sabe divertirse!
Mis compañeros de despacho, tanto los pasados como los presentes, Guille Peguero, Josep
Barba, Mar Unzeta, Víctor Granda, Jordi Margalef… han hecho honor a su calificativo en todo
momento, brindándome su ayuda y su buen humor y han conseguido que el despacho c5b/-
156 fuese mi segunda casa (además de armario y plaza de parking; desde aquí, chicos, mis más
sinceras disculpas por las molestias ocasionadas).
A los habitantes del despacho c5b/-158, Xavier Domene y Rosa Cañizares, por la paciencia y el
apoyo demostrados en todas mis incursiones, tanto las docentes como las de despacho a
media tarde. Siempre me habéis mostrado vuestro perfil más amable y divertido, y habéis
ampliado mis horizontes a muchos niveles; de vosotros me llevo vuestra perseverancia,
capacidad de superación ¡y vuestra chispa!
De Albert Gargallo me llevo mil cosas, pero sobre todo, las risas. ¡Ay las risas! Risas de esas que
te dejan sin aliento y con dolor de barriga, risas por muchas razones y por ninguna en especial,
risas que son un bálsamo para el espíritu después de un mal día. Gracias por ser “el follonero”

del CREAF y por traer a nuestra perrita terapéutica, Boira, para que las jornadas de trabajo nos
resultaran más livianas.
Gracias también a mis compañeras y amigas Marta Ayala (mi pequeña agrostis), Irene Raya,
Rosa Cañizares y Luciana Mota, por llevar la sororidad por bandera, compartiendo siempre
conmigo sus conocimientos y actitud positiva ante la vida y sus vicisitudes.
Al tridente Xavi-Jordi-Carlos, por compartir conmigo la rutina diaria y llegar a formar parte de
esa familia circunstancial que una misma elige, y que tan importante es cuando te vas a vivir
“fuera”. Gracias por ser una compañía tan sana y divertida y por hacer de nuestras salidas
campestres, momentos de recreo y aprendizaje.
No me olvido de Marta y Magda, que me han ayudado en mil trámites dando siempre
sobradas muestras de su profesionalidad y buen humor. Me dejo en el tintero muchos
nombres, compañeros de estancia, café y pasillo que no he llegado a conocer en profundidad
pero que, igualmente, no han dudado en echarme una mano siempre que lo he necesitado;
compañeros que con su savoir faire en el entorno laboral, han hecho que trabajar en el CREAF
haya sido un lujo tanto a nivel personal como científico.
Gracias a TODOS, por estos cuatro años sin “depres” de domingo ni lunes cuesta arriba,
síntomas inequívocos de felicidad y disfrute del presente. Mi etapa como doctoranda termina
aquí y ahora con la satisfacción del trabajo bien hecho y la certeza de haber vivido una
experiencia que me acompañará allá donde vaya.

Table of contents
Abstract 1
Chapter 1 : General Introduction
1.1. Biodiversity in a context of land-use change 5
1.2. What drives the assembly of communities: The role of landscape attributes vs.
species traits 6
1.3. Genetic dynamics and structure in expanding forests 8
1.4. Species interaction assembly and ecosystem functioning 9
1.5. Plant-insect interaction assembly in new forest patches: The case of new Quercus
ilex forests 11
1.6. Main objectives 13
1.7. Study system and study site 16
Chapter 2 : Community assembly in time and space: the case of Lepidoptera in a Quercus ilex
L. savannah-like landscape 21
Chapter 3 : Zero-sum landscape effects on acorn predation associated with shifts in granivore
insect community in new holm oak (Quercus ilex) forests 39
Chapter 4 : Do dispersal vs. dormancy strategies of tracking unpredictable resources leave
genetic signatures? A case of specialist insects inhabiting patchy habitats 59
Chapter 5 : Disentangling the effects of host genetic identity, ontogeny and spatial
distribution in insect herbivory in expanding oak forests 81
Chapter 6 : General discussion and conclusions 103
References 113
Appendix A 135
Appendix B 145
Appendix C 149

1
Abstract
The mechanisms driving species colonization and coexistence in habitats, is one of the main
puzzles in community ecology. Several theories, including niche, neutral and coexistence
theories, have tried to explain the biodiversity observed in natural ecosystems as the result of
deterministic, neutral, or a combination of both processes, respectively. This biodiversity will
assemble in communities and ultimately establish biotic interactions, which will play an
important role in the ecosystem dynamics and its resilience. Species interactions can only be
fully approached by the double perspective of landscape ecology and
metapopulation/metacommunity dynamics, and therefore both, landscape attributes and
species’ traits must be taken into account. Loss of communities and biotic interactions has
been thoroughly studied in the context of shrinking and fragmented habitats, as it is one of the
main threats to global biodiversity; however, the assembly of communities and biotic
interactions in new expanding natural ecosystems is a much less explored topic. In the current
context of global change, land transformation has resulted in loss and fragmentation of habitat
in many different ecosystems, however, recovery of natural habitats has also been observed.
Particularly in Europe, cropland abandonment has led to an intense process of forest
expansion and nowadays we can find patchy afforested areas all over the continent in which
an ongoing process of assembly is taking place. Especially in these patchy habitats, neutral
processes modulated by spatiotemporal landscape attributes as well as dispersal ability of
organisms could be playing a key role in the assembly of communities and biotic interactions.
Nevertheless, deterministic processes might as well be shaping communities and interactions
at other spatial scales
The aim of this thesis has been, therefore, to deepen in the knowledge of factors driving
community and interaction assembly, taking as study system the plant-insect interaction
established between species that have successfully colonized these expanding forest patches,
specifically Quercus ilex, a key species of the Mediterranean forests, and its community of
herbivore (folivore and granivore) insects. As a first objective, this thesis proves the impact of
spatiotemporal attributes at the tree scale on the assembly of the Lepidoptera community.
Chapter 2 shows a complex interplay of age, canopy size and connectivity of trees interspersed
in an expanding savannah-like Q. ilex landscape, leading to more abundant, richer and more
diverse Lepidoptera communities in older, larger and more connected trees, while alpha and

2
beta diversity depending exclusively on the distance between canopies, therefore validating
the importance of neutral and random processes on the assembly of the herbivore
community. As a second objective, this thesis explores the impact of spatiotemporal and
genetic attributes at the tree scale on herbivory. Chapter 3 shows a direct effect of tree
genetics on the leaf damage suffered by holm oaks, as well as an edge effect benefiting insects
at the core of the patch, while an indirect effect of age and connectivity, resulting in
associational resistance, is revealed among mature developmental stages of holm oak.
Additional support of tree characteristic impact on herbivory is found in Chapter 4, where
seed-predation is regulated by acorn size and tree connectivity, while it does not change
between habitats or landscapes at the local and regional scales, due to compensatory
dynamics of the different species within the seed-predator guild. This homogeneity in the
interaction, contrasts with the heterogeneity shown by seed-predator assemblages at the
three spatial scales, with colonization credits of the poorer dispersers in the most new and
isolated patches. Therefore, results of Chapter 4 evidence, indeed, the importance of studying
community and interaction assembly at different spatial scales as well as revealing different
seed-predator assemblages at the local scale but zero-sum landscape effects on seed-
predation at the landscape scale. In addition to effects on the composition of the community,
the colonization process mediated by landscape and species’ attributes can also have genetic
effects. Population genetic theory predicts a strong correlation between population size and
genetic variation, which in turn, is expected to correlate with fitness and adaptation potential.
In Chapter 5 we explore the effects of age and connectivity of the habitat in combination with
the dispersal vs. dormancy trade-off exhibited by some seed-predator species. Results reveal
significant genetic structure and low genetic variability only for the poor disperser Curculio
elephas, as well as restricted gene flow between old and new-isolated patches, in consonance
with colonization credits found for this species in Chapter 4. In spite of the founder effects,
consistent larger populations of C. elephas compared to the better disperser C. glandium
suggest that other factors are favoring the fitness of the former species
Overall, results included in this thesis provide a detailed insight on the processes that, at
different spatial scales, are mediating the Quercus ilex – herbivore assembly in expanding
forests, revealing the participation of all, niche, neutral and random processes. Findings also
suggest that the patchy arrangement of these expanding habitats are favoring the existence of
different herbivore assemblages, but with a resultant zero-sum impact of herbivory on holm
oaks. Differential colonization dynamics, mediated by differences in species dispersal ability,
have already left a genetic signature, which may impact seed-predator fitness and potential of

3
adaptation. The information provided in this thesis may be of great help for the management
of both, Q. ilex and herbivore populations in expanding forests, supporting decisions such as
size/shape patch maintenance of enhancement/reduction of inter-patch connectivity.

Chapter 1: General Introduction
5
Chapter 1: General Introduction
1.1 Biodiversity in a context of land-use change
In the present context of global change, land transformation is considered a primary threat to
biological diversity because it has resulted in loss and fragmentation of habitat in many
different ecosystem types (Vitousek et al. 1997). Estimates of complete habitat change vary by
biome from 0.4% (tundra) to 48.5% (tropical/subtropical dry broadleaf forests), with a 21.8%
of global land area converted to human-dominated uses (Hoekstra et al. 2005). Usually, the
term “land-use change” brings up implicitly the idea of loss of natural habitats and associated
species (Sala et al. 2000) due, obviously, to the massive extent of natural habitat loss
compared to that of natural habitat recovery. However, a change in the use a land is given can
also open the door to the emergence of new natural habitats and the assembly of new
communities; indeed, recovery of natural habitats (grasslands, forests, shrublands, savannas,
etc.) has been also observed.
According to the Global Forest Resources Assessment 2015 (Keenan et al. 2015), in spite of the
global 3%-decline in forest area from 1990 to 2015, temperate forests have expanded. This
forest expansion has profound ecological implications due to the key functions and ecosystem
services forests globally provide, including maintenance of wildlife habitat (Foley et al. 2005;
Loo 2009). It has been estimated that only in Europe, forest cover has increased by about 25%
during the second half of the twentieth century as a consequence of cropland abandonment
and natural transition to woodlands (Fuchs et al. 2013). Recent afforestation might be
especially important in Mediterranean forests, considering their historical deforestation
(Cervera et al. 2015). In consonance with the forestation trends across the continent, some
regions of the Iberian Peninsula have also experienced intense forest expansion, with about
25% of the current forest cover emerged in the last decades (Baśnou et al. 2013).
Mediterranean forests, compared to temperate or boreal forests, are characterized by high
spatiotemporal complexity and heterogeneity regarding functional dynamics at landscape and
local levels, as well as species composition and richness (Lefèvre & Fady 2016). Identifying the
most relevant drivers of community assembly, especially in these highly variable
Mediterranean ecosystems, is not an easy task, but it is still crucial to guarantee the
persistence of functional communities under the current context of global change (Fleishman

Chapter 1: General Introduction
6
et al. 2002; Opdam & Wascher 2004). Ecologists have added temporal, genetic and spatial
structure to the concepts of population and community in order to address all the possible
sources of variability. Although different species may respond differently to changes in the
same landscape context, depending on their degree of habitat specialization, body size,
resilience or dispersal abilities, very few studies have focused on the rearrangement of whole
communities in these new habitats.
1.2 What drives the assembly of communities: The role of landscape attributes vs. species
traits
To answer the question “what drives the assembly of communities?” we first need to state
clearly what we understand by “community assembly”. Following HilleRisLambers et al. 2012,
we define community assembly, as “the process by which species from a regional pool colonize
and interact to form local communities”. That is, a subset of species belonging to a regional
species pool, are available for the colonization of a particular site and form new local species
pools. However, the myriad of processes influencing this community assembly is such, and the
range of spatiotemporal scales involved so wide, that disentangling the identity and
importance of community assembly drivers, seems an insurmountable task.
Historically, community assembly has been built on classical niche differentiation theory
(Macarthur & Levins 1967; Chase & Leibold 2003; Tilman 2004; Leibold & McPeek 2006) that
explains biodiversity as the result of deterministic processes. Despite its importance in ecology,
the niche differentiation theory fails to explain many patterns in community assembly, and
since the mid-20th century, it has been challenged by neutral theory, which emphasizes the
importance of stochastic processes (Hubbell 2001; Rosindell et al. 2011). Neutral theory has
three basic assumptions: the neutrality, the point mutation and the zero-sum ones. Despite
the criticism on these restrictive assumptions, neutral theory fits very well some ecological
patterns (abundance-occupancy relationships, species turnover, distance-decay relationships)
in a variety of communities (Bell 2001; Chave and Leigh 2002; Ulrich and Zalewski 2007) and
substantial improvements have been accomplished in order to make the original assumptions
more realistic (Etienne et al. 2007; Rosindell et al. 2011; Rosindell and Cornell 2013; Matthews
and Whittaker 2014). Hubbell’s ‘individual-based’ neutral theory was explicitly formulated
after the ‘species- based’ equilibrium theory of island biogeography (MacArthur & Wilson 1963,

Chapter 1: General Introduction
7
1967), and one of its most important contributions to community theory is the emphasis on
dispersal limitation as a dominant factor in determining species abundances. Niche differences,
although they certainly exist, are effectively neutral and therefore do not drive local
abundances and distributions of species.
In spite of these niche-based and neutral theories being the two main theoretical frameworks
in ecology assembly, an emerging consensus about the complementarity and simultaneity of
both, deterministic and stochastic processes in structuring communities, seems to be
consolidating among researchers (Tilman 2004; Gravel et al. 2006; Vergnon et al. 2012). In
coexistence theory, competition among species would not lead to exclusion but rather to a
dynamic coexistence mediated by the shift in species’ fitness according to the species
abundance at a time. These so-called stabilizing differences, would be involved in key
processes such as distance- and density-dependent recruitment and resource partitioning,
driving population growth and dynamics (Chesson 2000; Chase & Leibold 2003).
Community assembly can be summarized as the outcome of both metapopulation and
metacommunity dynamics determined by the interplay between landscape and species
attributes (Hanski 1994; Ettema & Wardle 2002; Holyoak et al. 2005). Regarding landscape
attributes, these metapopulation and metacommunity dynamics are primarily related to
landscape structure (see McCoy & Bell 1991; Lomolino 1994; Hubbell 1997). Increasing habitat
patch area and connectivity increases the probability of a species to reach and establish
successfully in an unoccupied habitat and thus, may enhance local diversity at community level
(Bailey et al. 2007; Brückmann et al. 2010).
Regarding species attributes, dispersal ability in space (including mobility across the landscape
matrix) and time (i.e. dormancy/ diapause strategies) is a primary driver of metapopulation
and metacommunity dynamics, as it determines the spatiotemporal scales at which species
experience the landscape (Tscharntke et al. 2002). A great dispersal ability in space will reduce
the risk of local extinction by reducing landscape matrix effects (Murphy & Lovett-Doust 2004;
Tscharntke & Brandl 2004) and increasing the propagule pressure (i.e. propagule numbers;
Simberloff 2009). Similarly, a variable dormancy will spread the local extinction risk by scaling
emergence of adults, guarantying the survival of some individuals to years of unfavorable
environmental conditions (Pélisson et al. 2013). However, both strategies are highly energy
demanding, and so trade-offs between these two strategies are common in nature (Roff 1986;
Zera et al. 1997; Zera & Harshman 2001). These trade-offs between both attributes might

Chapter 1: General Introduction
8
affect species composition in fragmented landscapes as well as rule the relative frequency of
the species following one strategy or the other (Amarasekare 2013).
Still, community assembly will also depend on the inherent habitat succession dynamics (e.g.
afforestation following crop abandonment) that will bring changes in the habitat quality and
structure to which species will have to cope with and adjust. Thus, extinctions and
colonizations of species in dynamic landscapes and habitats often occur with time lags (Jackson
& Sax 2010), and both extinction debts (i.e. the number of species expected to go extinct as a
new habitat reaches its equilibrium state; see Kuussaari et al. 2009) and colonization credits
(i.e. the number of species committed to eventual immigration following a forcing event; see
Cristofoli & Mahy 2010; Jackson & Sax 2010) have been identified following changes in habitat
quality, amount or connectivity. Regarding colonization of new habitat patches, we would
expect greater species richness as habitats get older and colonization credits are gradually paid
off. In any case, while patch age per se may play a relevant role in structuring ecological
communities (Borges & Brown 1999; Hubbell 2001), its effects have been less explored than
that of habitat quality and structure (Drake et al. 2002).
1.3 Genetic dynamics and structure in expanding forests
Based on simple population genetic theory, a strong correlation can be expected between
population size and genetic variation, which in turn, is predicted to also correlate with fitness
(Leimu et al. 2006). Recently established secondary forests can exhibit founder effects, kinship
structure and genetic drift (Petit et al. 2004) due to small population sizes and/or low genetic
variability. At evolutionary scales, reduced genetic diversity decreases the potential of species
to adapt to changing environments, and at the ecological scale, they may reduce fitness,
especially in small populations (Ellstrand & Elam 1993). Nevertheless, this will only be true in
natural populations if they are not regulated to a greater extent by other factors. In species
exhibiting zoochory, recruitment in new patches can be assisted by long-distance dispersers
carrying seeds from distant populations, thus enhancing genetic variability within the new
forest and consequently, diluting the founder effect. Previous studies carried out in similar
expanding forests have already documented the importance of regular assisted arrival of seeds
from other patches in the expansion of the forest studied (Gerber et al. 2014; Gerzabek et al.
2017). This genetic variation will lead to individual phenotypic variation in resistance traits (i.e.

Chapter 1: General Introduction
9
trichomes, leaf toughness, tanins, glycosides, etc.), which, in turn, has been proven to impact
insect density and performance (Awmack & Leather 2002; Ruhnke et al. 2006; Hughes et al.
2008). However, literature on host-genotype effects on insect herbivory is scarce and results
are highly context- and species- dependent (Mopper et al. 1991; Donaldson & Lindroth 2008;
Maldonado-López et al. 2014) probably owing to not including in these studies other traits that
may mediate in the relevance of genetics for herbivory damage: i.e. plant developmental stage
and connectivity (Guyot et al. 2016; Moreira et al. 2017; Fernandez-Conradi et al. 2017).
Similarly to plants, a positive relationship between population size, genetic variation and
fitness is expected for animal populations (Reed & Frankham 2003). Indeed, endangered
species typically have lower levels of heterozygosity, smaller population sizes and/or lower
genetic variability than related no endangered species (Frankham 2005; Haig & Avise 1996). In
newly established populations, genetic structure is often determined both, by historical events
(i.e. bottlenecks and founder effects) (Franklin et al. 2014) and species-specific characteristics
(i.e. dispersal ability) (Duminil et al. 2007; Timm & Geertsema 2008). Species with good
dispersal abilities will show a higher gene-flow across patches and a resultant weak genetic
structure, compared to poorly dispersed ones; yet, local genetic diversity might be higher in
the highly dispersed species due to the recurrent arrival of new immigrants (Hastings &
Harrison 1994), even though a proportion of these immigrants might eventually die because of
their limited resilience. In contrast, species that are more resilient could be less genetically
diverse at local scale due to their lower dispersal abilities, especially in very isolated patches,
yet this could be counterbalanced by a larger population size due to their lower likelihood to
suffer local population bottlenecks (Frankham 2005). In the expanding forests of the Iberian
Peninsula studied in these thesis, herbivores are known to differ greatly in their dispersal
abilities (Venner et al. 2011; Pélisson et al. 2013) and therefore we expected that these
differences had already impacted their population genetic structure and diversity.
1.4 Species interaction assembly and ecosystem functioning
Species interactions are often ignored in the context of global change even though they will be
the first link disappearing from local communities as a precursor to local (and ultimately global)
extinctions as habitat availability shrinks (Albrecht et al. 2007;Sabatino et al. 2010; Woodward
Chapter 1: General Introduction
10
et al. 2010). Understanding the processes underlying species interaction assembly is thus of
vital importance to provide critical new insights into ecological responses to perturbations.
The metapopulation and metacommunity concepts have their roots in island biogeography
and they have provided valuable insights in the regional persistence of interacting local
populations/communities through spatial dispersal. However, species interactions can only be
fully understood from a double-perspective approach: a population/community perspective,
concerned with metapopulation/metacommunity dynamics, as well as a landscape perspective,
concerned with ecological processes in explicitly structured ecosystems (Pickett & Cadenasso
1995; Turner et al. 2001). Therefore, species interactions should be addressed by explicitly
considering communities into ecosystems, with abiotic constraints of the environment and
feedbacks of the community influencing this environment. The meta-ecosystem concept is a
natural extension of the metacommunity concept, which includes these abiotic constraints and
feedbacks, providing a theoretical framework integrating population/community and
landscape ecology in spatial ecosystem ecology (Loreau et al. 2003). Again, the dichotomy
between niche and neutral models shape the proposed species-interaction assembly at meta-
ecosystem level, involving several spatiotemporal scales and species’ traits (Thies et al. 2003).
While species sorting is often associated with niche differences among habitat patches and
inter-specific competitive ability, both mass effects and neutral processes are frequently
determined by the interaction of habitat spatial structure and animal dispersal abilities
(Shmida & Wilson 1985; Pulliam 1988). Sorting, or environmental filtering, will modulate local
species interactions through competitive exclusion, whereas movement among local
communities would be the regional process that counterbalances sorting effects by
homogenizing species distributions (Wang & Loreau 2016). It will be at intermediate
movement levels, when reciprocal effects of local and regional processes will arise, with both
regional and local diversity and relative species abundance being the result of a balance
between local sorting and immigration from the regional metacommunity. As posited by the
third assumption of neutral theory, this balanced dynamics would lead to competing species
exhibiting zero-sum dynamics, i.e. density compensation or trade-off processes, in their
abundance (Ernest et al. 2008), which could also extend to ecosystem processes like trophic
cascades and nutrient cycles in a spatiotemporal context. Yet these meta-ecosystem effects
(sensu Loreau et al. 2003) have been poorly investigated.

Chapter 1: General Introduction
11
Effects of landscape structure and dynamics on metapopulation and metacommunity
processes also drive species interactions and the resulting ecosystem functioning (Tscharntke
et al. 2012). Indeed, habitat connectivity might help to promote mass effects on herbivore
populations, thus increasing colonization success and damage on host-plant species, while
specific patch dynamics might promote or arrest these landscape processes (Leibold et al.
2004). Landscape attributes may also determine zero-sum effects on plant-herbivore
interactions if there is merely a substitution of species among patches. At a regional scale,
more resilient species with poor dispersal abilities will be constrained to stable and highly
connected habitat patches, while species with higher dispersal abilities will colonize new and
isolated ones (Hendrickx et al. 2009; Hernández et al. 2014; Evans et al. 2015). Thus, dispersal
ability (including mobility across the landscape matrix) is a primary driver for community
assembly and governs the reorganization of species interactions in patch dynamics across the
landscape (Thompson & Gonzalez 2017). Surprisingly, few studies have explored the effects of
habitat recovery on the assembly of plant-animal interactions (de la Peña et al. 2016) despite a
growing number of them have analysed the effect of landscape structure on plant-animal
interactions in a context of habitat loss and fragmentation (Didham et al. 2012; Guardiola et al.
2017).
1.5 Plant-insect interaction assembly in new forest patches: The case of new Quercus ilex
forests
Albeit largely ignored, specialist phytophagous insects are among the first organisms colonising
new habitat patches, concurrently with plant communities (Lawton 1983). This process has a
non-negligible, yet scarcely studied, spatiotemporal component (but see de la Peña et al.
2016). Indeed, a limited set of previous studies highlighted the importance of the interplay
between landscape attributes (i.e. size, connectivity and age), and species’ traits (mostly
dormancy and dispersal ability) in the assembly of plant-insect interactions in new habitat
patches (Bouget et al. 2015). For example, changes in habitat connectivity commonly affect
frequency and abundance of specialist insects (Thomas et al. 2001; Kruess 2003). On the other
hand, a number of studies have highlighted the combined effect of habitat structure and age
on insect species richness and abundance (Inoue 2003; Tscharntke & Brandl 2004; Jeffries et al.
2006; Taki et al. 2010), with the poorest dispersers exhibiting colonization credits in recent
habitats (Heiniger et al. 2014), yet results are highly idiosyncratic.

Chapter 1: General Introduction
12
Specifically regarding plant-insect interactions, we can find some empirical studies on the role
of habitat age and connectivity in the community assembly of herbivores and their
consequences for the host plants (e.g. Tscharntke & Brandl 2004), while effects on predator
insects have attracted much less attention (but see Orrock et al. 2003; Orrock & Damschen
2005). Plant expansion in younger or more isolated patches may be favoured by decreasing
insect damage, in a sort of “enemy release” effect (Koivula et al. 2002; De la Vega et al. 2012;
Fountain-Jones et al. 2015), or arrest it when hosts plants in new isolated patches are highly
affected by herbivores, as these are released from their natural enemies (Roland 1993;
Terborgh et al. 2001). Therefore, changes in the spatiotemporal pattern of habitat patches
might lead to insect community shifts depending on species attributes like dispersal and
resilience (e.g. Hendrickx et al. 2009; Hernández et al. 2014; Evans et al. 2015) yet the effects
(i.e. positive, negative or neutral) on species-plant interactions are not clear.
Many studies exploring the effects of invertebrate herbivory on forest dynamics focused on
tropical forests (Weissflog et al. 2018). The knowledge about herbivory impact on temperate
forests is much scarcer (but see Piper et al. 2018, article in press), especially in forests that are
in expansion (Lemoine et al. 2017). Interestingly, Europe has undergone a process of greening
in the last decades, reversing centuries of deforestation (Meyfroidt & Lambin 2011), with
transition to woodlands being the most extensive land-use change in recent years, followed far
behind, by urban expansion (Meiner & Pedroli 2017). In particular, European Mediterranean
forests, which historically showed strong reductions in their extent (Grove & Rackman 2001),
have partially recovered in the last 50 years, especially in mountain and former agricultural
areas (Lloret et al. 2002; Marull et al. 2010; Baśnou et al. 2013). As a result, nowadays these
landscapes consist of habitat patches that have persisted through past centuries, but also
younger dynamic patches with ongoing changes in their environmental conditions and species
composition. Insect herbivores can influence the regeneration dynamics of these new forests
through selective predation, altering the succession trajectories of the ecosystem particularly if
herbivory affects recruitment and mortality of key species of the ecosystem (Lemoine et al.
2017).
Quercus ilex is one of the woody species that have successfully colonized new Mediterranean
forest patches emerged in abandoned agriculture and pasture areas since the 1950s in many
parts of the Iberian Peninsula (Guirado et al. 2008; Puerta-Piñero et al. 2012; Basnou et al.
2016). The expansion of these populations are expected to reflect the history of the landscape

Chapter 1: General Introduction
13
and specific life-history traits of this woody species, as well as have deeply determined the
assembly of other animal species that interacts and find food and shelter in it. Quercus ilex can
be considered a key species of Mediterranean forests due to the wide range of interactions it
establishes as well as the services it provides (Plieninger et al. 2010; Iriarte-Goni 2013; López-
Sánchez et al. 2016). Recent studies on plant community assembly in new established
Mediterranean forests, including our study area, have revealed a delayed colonization of Q.
ilex, compared to other species that have already exhausted their immigration credits (Basnou
et al. 2016). In general, the genus Quercus supports species-rich assemblages of specialist
phytophagous insects that are a major component of world biodiversity and form part of
numerous trophic interactions (Novotny & Missa, 2000). Folivore specialists of Q. ilex in Europe
belong to the Noctuidae, Geometridae, Tortricidae and Drepanidae families (Bellmann 2017)
amongst others. Regarding seed-predation, Curculio elephas, Curculio glandium and Cydia
fagiglandana are the most prevalent predator of Q. ilex acorns in the Iberian Peninsula
(Espelta et al. 2009a). Herbivory and seed-predation can affect tree primary productivity and
viable seed pool for regeneration and so they might be modulating Q. ilex expansion dynamics
in these new forests. In turn, the maintenance of the abovementioned biological diversity and
ecosystem services depends on the successful regeneration of holm oaks. There exist some
recent literature on the assembly of plant community in these new Mediterranean forests
(Guardiola et al. 2013; Bagaria et al. 2015; Basnou and Pino 2015), nevertheless these studies
have not been extended to other organism communities (e.g. insects), neither considered the
role of species and landscape attributes in the assembly of the insect-plant interactions and its
consequences: i. e. herbivory and granivory.
With this thesis I aim to fulfil the current lack of knowledge about biotic interaction assembly
in new Mediterranean forests taking as study system the holm oak and its community of insect
herbivores.
1.6 Main objectives
In this thesis I address the assembly of new insect communities and plant-insect interactions in
expanding Q. ilex forests in order to shed some light on this complex process in the yet
scarcely studied context of habitat recovery. We focus on the interaction of landscape
attributes such as age and connectivity, and species’ traits such as dispersal and dormancy
Chapter 1: General Introduction
14
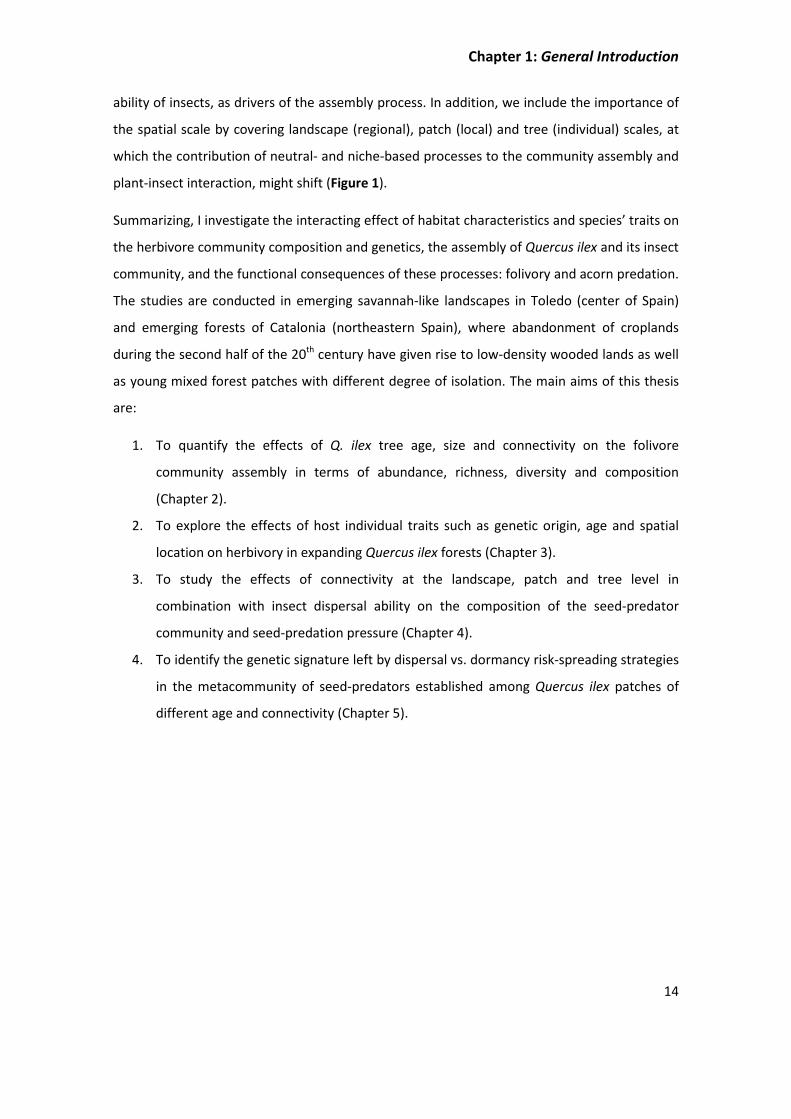
ability of insects, as drivers of the assembly process. In addition, we include the importance of
the spatial scale by covering landscape (regional), patch (local) and tree (individual) scales, at
which the contribution of neutral- and niche-based processes to the community assembly and
plant-insect interaction, might shift (Figure 1).
Summarizing, I investigate the interacting effect of habitat characteristics and species’ traits on
the herbivore community composition and genetics, the assembly of Quercus ilex and its insect
community, and the functional consequences of these processes: folivory and acorn predation.
The studies are conducted in emerging savannah-like landscapes in Toledo (center of Spain)
and emerging forests of Catalonia (northeastern Spain), where abandonment of croplands
during the second half of the 20th
century have given rise to low-density wooded lands as well
as young mixed forest patches with different degree of isolation. The main aims of this thesis
are:
1. To quantify the effects of Q. ilex tree age, size and connectivity on the folivore
community assembly in terms of abundance, richness, diversity and composition
(Chapter 2).
2. To explore the effects of host individual traits such as genetic origin, age and spatial
location on herbivory in expanding Quercus ilex forests (Chapter 3).
3. To study the effects of connectivity at the landscape, patch and tree level in
combination with insect dispersal ability on the composition of the seed-predator
community and seed-predation pressure (Chapter 4).
4. To identify the genetic signature left by dispersal vs. dormancy risk-spreading strategies
in the metacommunity of seed-predators established among Quercus ilex patches of
different age and connectivity (Chapter 5).
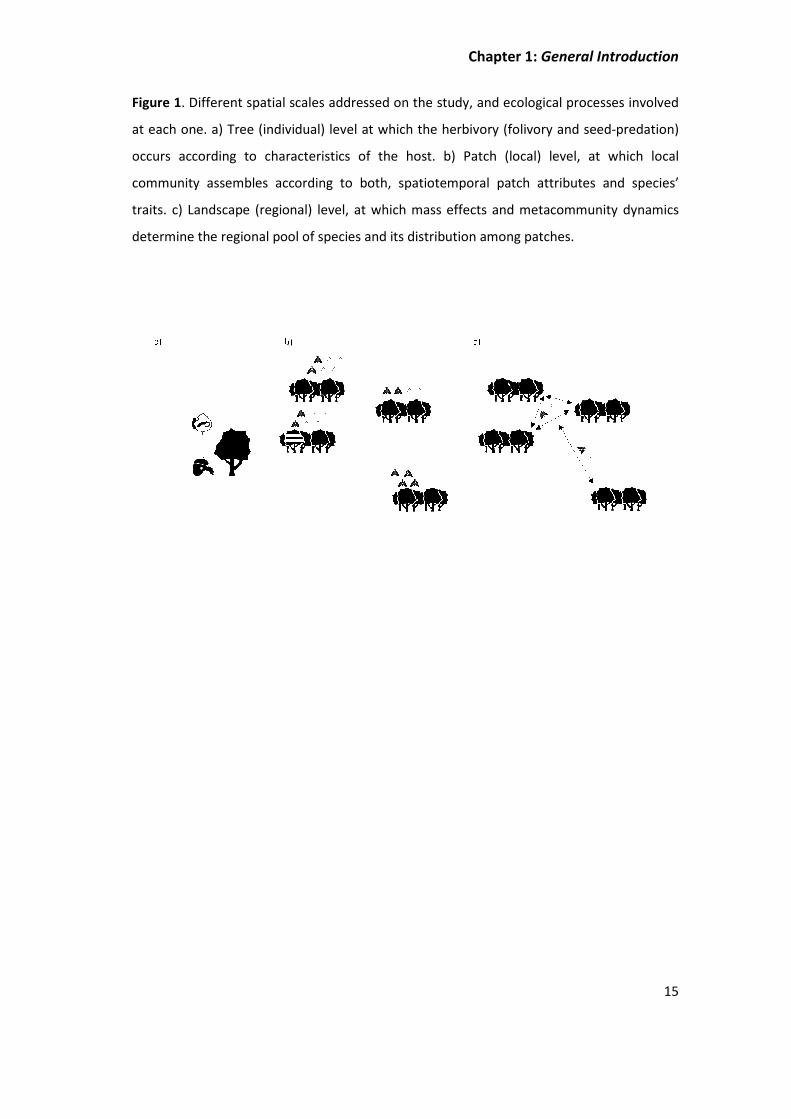
Figure 1. Different spatial
at each one. a) Tree (individual)
occurs according to characteristics of the host. b) Patch
community assembles according to both, spatiotemporal patch attributes and species’
traits. c) Landscape (regional)
determine the regional pool
Chapter 1: General Introduction
. Different spatial scales addressed on the study, and ecological p
at each one. a) Tree (individual) level at which the herbivory (folivory and seed
occurs according to characteristics of the host. b) Patch (local) level, at which local
assembles according to both, spatiotemporal patch attributes and species’
(regional) level, at which mass effects and metacommunity dynamics
regional pool of species and its distribution among patches.
General Introduction
15
processes involved
level at which the herbivory (folivory and seed-predation)
(local) level, at which local
assembles according to both, spatiotemporal patch attributes and species’
community dynamics
.
Chapter 1: General Introduction
16
Study system and study site
Regenerating wooded areas after land-use change
Field work of this thesis was carried out in two kind of regenerating habitats. Firstly, a
savannah-like landscape located in Huecas (Toledo, Central Spain; Figure 1) with a very low
density of holm oaks (from <1 to 100 oaks per ha; Bonal et al. 2012), with trees standing either
as remnants of clutched holm oaks or as completely isolated individuals embedded in an
agricultural matrix. Regeneration in the area started after the ease of agriculture, which
allowed holm oaks kept, so far, at the boundaries and interspersed within the croplands, to
grow. The trees chosen for the study differ in age, canopy size and connectivity and thus,
Lepidoptera community feeding on this species is expected to colonize each tree according to
these spatiotemporal characteristics. Secondly, forest patches spread throughout the Vallès-
Penedés lowlands (northeastern Iberian Peninsula) with different degree of isolation and age
(Figure 2). Landscape is a mosaic of forest patches of different ages (pre- and post-
agricultural), Quercus species being mostly concentrated in pre-existing forests and Pinus
species in recent ones (Guirado et al. 2008). These new forest patches in the Vallès-Penedés
lowlands are embedded in highly anthropised landscapes (Terradas 1999), and their
recruitment still depend on the activity of seed dispersers (e.g. jays Garrulus glandarius L. and
wood mice Apodemus sylvaticus L.; see (Bossema 1979; Jensen & Nielsen 1986). In order to
study the impact of landscape structure and age on community assembly, we established
patch age using historic (1956) and present (2005) land cover maps available for all Barcelona
province. In doing so, we were able to distinguish forests emerged after cropland
abandonment or in a primary succession stage in 1956, from forests that were already present
back that time (named “new forests” and “old forests” respectively).
Both ecosystems are the result of land-use changes but due to their marked differences in
encroachment, they provide the study with a complementary view of the community assembly
process.
Herbivore community
Holm oaks host a diverse community of insects (Müller & Goßner 2007), including specialist
Lepidoptera species that feed on leaves and fresh shoots (Gómez de Aizpúrua 2003; Robinson,

Chapter 1: General Introduction
17
G. S. et al. 2010) (see Figure 3). Crown structure can be of great importance for these
organisms, especially for caterpillars, which are very sensitive to changes in microclimatic
conditions and also suffer predation from birds. Regarding adults, they can easily select habitat
patches thanks to their mobility, so they will show an active and quick response to habitat
change through time. Therefore, this Lepidoptera community constitutes an ideal model for
testing landscape structure and age impact on insect colonization dynamics.
Holm oaks are also the habitat for seed predators. In the Iberian Peninsula, the most important
species predating upon holm oak acorns are moths of the family Tortricidae (e.g., C.
fagiglandana) and weevils of the genus Curculio spp. (Coleoptera: Curculionidae) like C.
elephas and C. glandium (Espelta et al. 2009b) (see Figure 3). Larvae of these species develop
within acorns, commonly exhausting cotyledons and even killing the embryo, so they can
lessen the potential recruitment of the nutritious plant. The extent of damage is partly
dependent on life-history traits of the holm oaks related to predator satiation such as acorn
size and acorn production, but also on life-history traits of predators related to extinction risk
spreading spatially and temporally. These seed-predators differ markedly on these life-history
traits such as dispersal ability and dormancy and so they constitute ideal guilds to study the
effects of landscape structure and age on community assembly. Regarding flight abilities, the
small- bodied C. glandium can disperse double the maximum distance estimated for the larger-
bodied C. elephas (1200 m vs. 600 m, respectively), but it shows a fixed diapause of 2 years
while C. elephas can spread the emergence of adults from the same cohort from 1 to 3 years
(Pélisson et al. 2013). Compared to these two weevil species, Cydia exhibits good dispersal
abilities but does not have any dormancy strategy (Schumacher et al. 1997). Moreover, there
also exist differences in the way they predate upon acorns: while weevil larvae are constrained
to develop inside a single acorn, single moth larva can shift acorns during its development, not
always exhausting the cotyledon tissues (Soria 1999).

Figure 1. Left image: Aerial orthoimage of the savannah
with the location of the holm oaks studied, marked with red dots. Right images: differential
spatial connectivity within the study area, from highly isolated canopies to a low
Chapter 1: General Introduction
image: Aerial orthoimage of the savannah-like landscape in Huecas (Toledo),
with the location of the holm oaks studied, marked with red dots. Right images: differential
spatial connectivity within the study area, from highly isolated canopies to a low
General Introduction
18
like landscape in Huecas (Toledo),
with the location of the holm oaks studied, marked with red dots. Right images: differential
spatial connectivity within the study area, from highly isolated canopies to a low-density forest.

Figure 2. Upper image: Regional context of the study site, with little yellow dots indicating the
location of new isolated patches studied in Chapter 2, and large red dots indicating the
expanding forest patches studied in Chapters 3 and 4 within the Vallès
Lower image: a) Orthoimages
in Chapter 3, with sampled individual
actual) of one of the replicates studied in Chapter 4 and 5, with the O
(connected new forest) and INF (isolated new forest) patches highlighted in red.
Chapter 1: General Introduction
Regional context of the study site, with little yellow dots indicating the
location of new isolated patches studied in Chapter 2, and large red dots indicating the
expanding forest patches studied in Chapters 3 and 4 within the Vallès-Penedès lowlands.
Orthoimages (historical and actual) of one of the isolated new forests studied
in Chapter 3, with sampled individuals highlighted in yellow. B) Orthoimages (historical and
actual) of one of the replicates studied in Chapter 4 and 5, with the OF (old forest), CNF
(connected new forest) and INF (isolated new forest) patches highlighted in red.
General Introduction
19
Regional context of the study site, with little yellow dots indicating the
location of new isolated patches studied in Chapter 2, and large red dots indicating the
Penedès lowlands.
isolated new forests studied
Orthoimages (historical and
F (old forest), CNF
(connected new forest) and INF (isolated new forest) patches highlighted in red.

Figure 3. Families of the Lepidoptera folivore community and the seed
Chapter 1: General Introduction
. Families of the Lepidoptera folivore community and the seed-predator guild.
General Introduction
20
predator guild.
Chapter 2: Community assembly of Lepidoptera
21
Chapter 2: Community assembly in time and space: the case of
Lepidoptera in a Quercus ilex L. savannah-like landscape
RUIZ-CARBAYO, H., BONAL, R., ESPELTA, J. M., HERNÁNDEZ, M., PINO, J.
Published in Insect Conservation and Diversity (2017), Vol 10, pp. 21-31
Abstract
1. The factors governing community assemblages in fragmented habitats remain a
challenging topic in ecology, especially in the present context of global change. We
studied the colonization of holm oak (Quercus ilex L.) woodland by specialist
Lepidoptera in an afforested savannah-like landscape that has emerged as a result of
the abandonment of croplands. We sampled herbivorous caterpillars for five years to
assess the interplay between tree age and structure (canopy size and connectivity) on
Lepidoptera species abundance, richness, diversity, and composition.
2. 1336 individuals belonging to 24 species of Lepidoptera were collected. Species
abundance, richness and diversity increased in the best connected large trees and in
the best connected young ones, probably because of the greater likelihood of
colonization and the existence of colonization credits, respectively. Although species
abundance, richness and diversity varied significantly between years in all trees, there
were no effects for tree age, canopy size, or connectivity.
3. Although tree age and structure had little effect on overall species composition (alpha
and beta diversity), thereby revealing a predominant random effect, the relative
abundance of Noctuids and Pyralids was significantly affected by tree age, suggesting
that differences in dispersal abilities exist between these families.
4. These findings suggest that habitat age and structural interactions play a significant
role in the accumulation of Lepidoptera species but have little importance in
determining their identities. From a conservation point of view, the results highlight
the need to preserve old, large, and well-connected holm oak trees in agricultural
landscapes as refuges for specialist insects.
Chapter 2: Community assembly of Lepidoptera
22
Keywords: Habitat connectivity, habitat change, insect colonization, niche effects
2. 1 Introduction
The debate on the mechanisms that drive species colonization and persistence in habitats has
been alive in ecology since MacArthur & Wilson (1967) first broached the subject. During the
past five decades, the classical theory of niche differentiation, widely advocated to explain
community assembly (e.g. MacArthur & Levins, 1967; Chase & Leibold, 2003; Tilman, 2004;
Leibold & McPeek, 2006), has been challenged by diverse approaches that emphasize the
important function that species dispersal and propagule availability play in population
dynamics (Levin, 1974; Hubbell, 2006). Currently, empirical data show that the assembly of
ecological communities is governed by both niche- and dispersal-assembly rules (Cottenie,
2005), which thus implies that both environmental conditions and the spatial structure of
habitats play major roles in community assembly (see Andrén, 1994; Ribas et al., 2005;
Sobrinho et al., 2003; Spengler et al., 2011). In terms of habitat structure, i.e. the composition
and arrangement of objects in space (see McCoy & Bell, 1991), community dynamics are
assumed to be primarily related to patch geometry (area and isolation). Most studies show
that species richness increases with patch area and decreases as the degree of isolation grows
(Lomolino 1994; Hubbell 1997 and references therein). This species-area positive relationship
has been explained primarily in three different ways: (1) larger patches support larger
populations that have lower extinction risks (Preston, 1962); (2) larger patches are more
heterogeneous and have a higher number of vacant niches (Williams, 1964); and (3) larger
patches are more ‘apparent’ and are more likely to be colonized (Gilpin & Diamond, 1976). The
negative species-isolation relationship, on the other hand, depends on the differential
dispersal ability of a species, the distance to the nearest colonized habitat, and the landscape
matrix in between habitats (Murphy & Lovett-Doust, 2004; Tscharntke & Brandl, 2004).
Consequently, (a) the poorer the dispersal ability of the species, (b) the greater the distance
between patches, and (c) the less permeable the matrix, the lower the probability that the
habitat patch will be colonized and the scarcer the colonizing species involved (MacArthur &
Wilson, 1967; Simberloff & Wilson, 1969). Habitat structure in fragmented landscapes can vary
as a result of natural succession and stochasticity and so the age of the habitat may also play
per se an equal or even larger role in structuring ecological communities than environmental
and spatial variables (Borges & Brown, 1999; Hubbell, 2001). Indeed, due to time-lags in
colonization processes determining colonization credits (Jackson & Sax, 2010), we expect
greater species richness as habitats get older. In any case, the role of habitat age as an
explanatory variable of community attributes has been much less explored than the habitat
Chapter 2: Community assembly of Lepidoptera
23
structure and habitat conditions (Drake et al., 2002) in part owing to the lack of chronoseries
of community data that actually capture this temporal component of the assembly process. In
this regard, the use of certain short-lived animals such as insects as study models can be very
illustrative as they respond particularly quickly to environmental changes (Lawton et al. 1998;
McIntyre et al., 2001; Musolin, 2007). As an example, Badano et al., (2005), Taki et al., (2010),
Inoue (2003) and Jeffries et al., (2006) have all shed some light on the way insect communities
grow in different habitat scenarios taking into account the structure and age of the habitat;
nevertheless, their results are not consistent and the response of the community depends
greatly on the focus taxa. Such variability complicates the stating of general predictions and
therefore the significance of spatiotemporal effects on insect community assembly remains
largely unknown.
Besides the theoretical interest of this topic, spatiotemporal interactions in community
assemblies have acquired greater relevance in recent years as part of the attempt to
understand the consequences of changes in land use. For example, the abandonment of
croplands in Europe from the second half of the twentieth century onwards has led to the
appearance of new tracts of forest (Hermy & Verheyen, 2007; Bolliger et al., 2007; Meyfroidt &
Lambin, 2011; Basnou et al., 2013), which have been recolonized by many forest species.
Specialist phytophagous insects are often among the first organisms to colonize young trees,
where they find the shelter and reproduction sites that a hostile cropland matrix cannot
provide (Lawton, 1983). This process is thus taking place on a massive spatial scale and should
be studied in order to understand the factors and interactions driving the restoration of forest
ecosystems.
In certain parts of the Iberian Peninsula, increases of over 20% in the forest surface area has
been recorded in the last fifty years (Basnou et al., 2013). Secondary forests are dominated by
two main tree genera, Pinus and Quercus (Blanco et al., 1997; Pons & Pausas, 2006; DeSoto et
al., 2010). The genus Quercus supports species-rich assemblages of specialist phytophagous
insects that are a major component of world biodiversity and form part of numerous trophic
interactions (Novotny & Missa, 2000). We studied an area of Central Spain where the holm oak
(Quercus ilex L.) has progressively colonized former croplands and now appears in the form of
small forest patches and isolated trees (Ortego et al., 2010), and where the natural reassembly
of the Lepidoptera community associated with these oaks provides an interesting opportunity
for exploring the processes underlying community assembly from an island-biogeographic
perspective.

Chapter 2: Community assembly of Lepidoptera
24
The aim of this study was to evaluate to what extent the community assembly of Lepidoptera
in this new patchy habitat is affected firstly, by age, canopy size, and connectivity, and,
secondly, by the spatial pattern of the host plant Quercus ilex. Specifically, we addressed the
following questions: (1) Do Lepidoptera species abundance, richness, diversity, and species
composition vary between holm oaks of different age, canopy size, and connectivity? (2) Do
holm oak age, canopy size, and connectivity determine Lepidoptera species turnover (species
beta diversity) and does spatial location of the trees also play an important role? We expect
greater species abundance, richness and diversity of Lepidoptera caterpillars in older, larger,
and more connected holm oak trees, as well as different patterns of colonization by
Lepidoptera (different species assemblages) due to random dispersal and/or differences in
species’ dispersal abilities. To answer these questions we collected Lepidoptera caterpillars
from 23 holm oaks for five years and assessed the effects of tree age, canopy size,
connectivity, and their interactions on i) caterpillar abundance, ii) species richness, iii) species
diversity, and iv) the species composition of the community.
2.2 Material and Methods
2.2.1 Study area
The study was performed in Huecas (40° 0´N, 04° 11´W, Central Spain; Fig.1). Mean
temperatures range from 24–26 ºC in July to 4–6 ºC in January; mean annual rainfall is 350–
450 mm, mainly concentrated in spring and autumn and with a severe drought in summer
months. The landscape consists of both clustered and isolated holm oaks within an extensive
cereal field matrix (see Ortego et al. 2010 for a more detailed description). Tree density ranges
from <1 to 100 oaks per ha (Bonal et al., 2012). The comparison of historical and current
photographs reveals the on-going holm oak regeneration process, concentrated at the
boundaries of cropland areas and in marginal and abandoned land.
2.2.2 Study species
The evergreen holm oak (Q. ilex) is widespread in the Iberian Peninsula and forms primary and
secondary mixed forests, as well as savannah-like landscapes. It hosts a diverse community of
insects (Müller & Goßner, 2007), including several Lepidoptera species belonging to a number
of families that feed on leaves and fresh shoots (Robinson et al., 2010; see Appendix A, Table
A.1). Many are highly specific to the genus Quercus (Gómez de Aizpúrua, 2003; Robinson et al.,
2010) and constitute ideal models for assessing insect colonization of new forest patches in
Chapter 2: Community assembly of Lepidoptera
25
fragmented landscapes. Moreover, given the mobility of adults, Lepidoptera can respond in a
relatively short time to habitat succession processes and thus are also good models for testing
the effect of habitat age on community assemblages. Specialist species are in general
univoltine and their peak egg-hatching period is synchronized with the appearance of new
shoots in their food plants (which begins in mid-April in the study site). These phenologic
patterns give maximum species abundances in April and at the beginning of May (Fernández &
Jordano, 2004).
2.2.3 Experimental design and tree measurements
We chose 23 Q. ilex trees in the study site with a broad range of tree ages and canopy sizes.
Trees were distributed across approximately 680 ha, and the distances between them varied
from 4 m to 2 km.
We geolocated the study trees in the field using a global positioning system (GARMIN GPSMAP
62st) and determined their age (20–74-years old) by tree-ring dating and counting after
extracting a core from the trunk using a Pressler borer (see Gené et al., 1993). We also took
leaf area index (LAI) measurements from each tree crown along the four cardinal points using
a ceptometer (LP-80, DECAGON). The mean LAI values for each tree crown thus obtained were
used as a proxy of canopy density and biomass. In addition, we georeferenced all isolated holm
oak trees and patches in the study area in 2014 and converted the resulting vector layer into a
1x1-m grid. Trees studied in the field were identified in the 2014 layer by their spatial position.
We used orthoimages to determine tree crown perimeters and then the tree crown area inside
the perimeter for selected oaks using Miramon GIS tools (Pons, 2004;
www.creaf.uab.es/miramon). Canopy size values were in the range 12–104 m2 (see Appendix
A, Table A.2). Following the methodology used by Puerta-Piñero et al., 2012, we estimated the
connectivity for Lepidoptera of each study tree (Ci) using a modification of Hanski’s
connectivity index (Hanski, 1999):
Ci=∑(Ij·e-dij)
where Ij corresponds to each pixel of holm oak tree or patch different from the study tree i,
and dij to its distance to the edge of the study tree. We constrained the calculation of Ci to 1
km around each tree in accordance with previous studies that suggest that for many moth and
small butterfly species dispersal over 1 km is rare (Thomas et al., 1998). Map photo-
interpretation and calculation of the Ci was performed using Miramon (Pons, 2004) and
Quantum GIS for Windows.

Chapter 2: Community assembly of Lepidoptera
26
2.2.4 Lepidoptera sampling
We sampled the lower-canopy Lepidoptera community of holm oaks in five consecutive
springs (2010–2014). Since caterpillar abundance may depend on holm oak phenology
(Herrera, 2004), we always sampled trees well into the period of maximum activity (beginning-
middle of May; own observations) to avoid any interannual bias. Micro-environmental changes
within crowns can also affect Lepidoptera abundance (Summerville & Crist, 2008) and so we
split tree crowns into four parts based on the four cardinal points to sample the overall
conditions for the Lepidoptera community. In each position, we placed a beat sheet under the
canopy and gently beat all the branches of the corresponding canopy quarter six times with a
wooden stick. To control for sampling effort we always beat the trees the exact same number
of times. The caterpillars collected from each canopy division were placed in plastic containers
with ventilation and subsequently individually housed in plastic petri dishes. They were reared
on fresh Q. ilex foliage, which was periodically renewed until they reached the adult stage.
Caterpillars were checked for survival, pupation, and emergence every two days. We used
taxonomic guidebooks (Gómez de Aizpúrua, 2003) for identification to species level based on
external appearances. Many individuals were determined whilst still larvae, whereas others
were identified on the basis of adult traits.
Species diversity was determined using the exponential form of Shannon’s entropy
(subsequently termed Shannon’s Diversity to distinguish it from non-exponentiated Shannon’s
entropy): where S is the species richness and pi is the relative abundance of each species.
Due to its unique ability to weight elements precisely by their frequency without
disproportionately favoring either rare or common species, Shannon’s Diversity has proved to
perform better than many other diversity measures (Beck and Schwanghart 2010).
2.2.5 Data analysis
Prior to modelling we checked our landscape predictor variables for colinearity using Pearson’s
correlation coefficients.
Due to incompleteness in the sampling (Appendix A, Table A.1), we examined whether
differences in Lepidoptera species richness between holm oak trees were driven by differences
in Lepidoptera abundance captured in trees of different size by constructing rarefaction curves
exp (H’) = exp �− ∑ �� ln �� ��

Chapter 2: Community assembly of Lepidoptera
27
for small (12–43 m2), medium (43–79 m2), and large (79–104 m2) tree sizes, and then
estimated cumulative species per subsample size (Appendix A. Figure A.1). In addition, a rank-
abundance curve was plotted to determine whether the sampling effort was enough to
capture the long ‘tail’ of rare species that is characteristic of communities with low evenness
(Appendix A. Figure A.2). To determine how tree age, canopy size, and connectivity affect
Lepidoptera species richness, Shannon’s Diversity, and species abundance (log-transformed),
linear mixed effect models with different error structures were used to search for the best
possible fit. In addition, we included a spatial correlation structure in the models to control for
the presence of spatial autocorrelation in the data. We built saturated models with all fixed
effects plus their second-degree interactions; model selection was performed based on the
second-order Akaike Information Criterion (AICc) and adjusted R2. Models were run with tree
age, size, and connectivity. To better understand the resulting interactions, in the interaction
graphics tree size and age were categorized as 3-level factors — tree size: small (12–43 m2),
medium (43–79 m2), and large (79–104 m2); tree age: young (20–43 years), middle-aged (43–
56 years), old (56–74 years).
To assess the effect of tree age, canopy size, and connectivity on species beta diversity we
constructed pair-wise distance matrices for (1) species abundances, (2) geographic location,
and (3) habitat variables (age, canopy size, and connectivity) and then used them to run linear
models with the distance matrix of species abundances as response variable and
environmental distance matrices as factors (and correcting the sample size for the multiple
pair-wise comparisons). The model was subjected to bootstrapping to obtain reliable relative
weights of the explanatory factors.
Given that a detrended correspondence analysis (DCA) showed environmental range lengths
>2 SD, we carried out a Redundancy Analysis (RDA) to test the relationship between species
beta diversity and the environmental gradients. We constructed two data tables with
information on (1) total species abundance in each tree and (2) environmental variables
characterizing each tree (age, canopy size, and connectivity). RDA is based on Euclidean
distances and so we used the Hellinger transformation to solve the inherent problems of this
distance metric and to reduce the undue weight of species that may be abundant at a
particular place but rare at study-site scale (Legendre & Gallagher, 2001).
The study area has a Mediterranean climate characterized by high interannual variability and
so pair-wise differences in species abundance, richness and diversity between sampling years
were tested using Kruskal-Wallis test. We then calculated (1) coefficients of variation (i.e. the

Chapter 2: Community assembly of Lepidoptera
28
ratio of the standard deviation to the mean) for species richness, Shannon’s Diversity and
species abundance in order to quantify the interannual variation in the Lepidoptera
community, and (2) tested the habitat effects (tree age, canopy size, and connectivity) using
general linear models. To check any potential effect for tree age, canopy size, and connectivity
on the total and/or relative abundances of each Lepidoptera family, we carried out simple
linear regressions. Finally, we also explored the relationship between LAI and tree age using
linear regressions.
All statistical analyses were performed in R, version 3.0.3 (R Development Core Team, 2011).
2.3 Results
2.3.1 Description of the Lepidoptera community
In all, 1336 individuals belonging to 24 morphologically recognizable Lepidoptera species were
collected from the 23 study trees during the five years in which they were sampled. The
species belonged to the Noctuidae, Tortricidae, Pyralidae, Geometridae, Lycaenidae and
Drepanidae families (see Appendix A, Table A.1), of which the Noctuidae were the most
important in terms of the number of species (13). Seventeen species (80% of the total
individuals gathered) were Quercus spp. specific leaf-feeders, while the other seven can
potentially feed on other genera; however, at the study site all behave as specialists since no
other woody species are present. During the five-year period, one third of the species was
collected every year, another third was recorded in two, three, or four years, and the
remaining third appeared only once. In terms of total abundance, the most abundant species
was – by far – the Noctuid Catocala nymphagoga, followed by the Yortricid Tortricodes
alternella, the Noctuid Dryobotodes eremita, and the Pyralid Phycita torrenti (Appendix A,
Table A.1).
2.3.2 Effects of tree age, canopy size and connectivity, on species abundance, richness and
diversity
The best models for community characterization were those considering tree age, canopy size,
and connectivity plus their second-degree interactions (Appendix A, Table A.4). Results
revealed complex interactions between tree age, canopy size, and connectivity that
significantly affected Lepidoptera abundance, richness and Shannon’s Diversity (Appendix A,
Table A.4). For smaller canopies, Lepidoptera communities were more abundant, richer, and
more diverse in older trees; nevertheless, the age effect was barely observable in the largest

Chapter 2: Community assembly of Lepidoptera
29
trees (Fig. 2: 1.a, 1.b, 1.c). In consonance with these results, although LAI values increased
significantly with age for trees within the smallest size category (R2=0.13; F1,43=7.502; P=0.008),
no significant increments were detected within the other two tree size categories (P>0.05).
Yet, trees with larger canopies were most influenced by connectivity, i.e. in larger trees,
species abundance, richness and diversity increased as the canopies became more connected
(interaction tree canopy size and connectivity; see Table 1, Fig. 2: 2.a, 2.b, 2.c), suggesting thus
that connectivity may only contribute to determining the Lepidoptera community assembly
once the host plant reaches a certain size. Finally, the interaction between tree connectivity
and tree age indicates that species richness and abundance – but not Shannon’s Diversity –
increased in younger trees as they became more connected (Fig. 2: 3.a, 3.b). Models explained
28%, 36%, and 36% of variance in species abundance, richness and Shannon’s Diversity,
respectively, with the random factor (i.e. year of sampling) accounting for 15%, 24%, and 26%
of total variance, respectively. Although Lepidoptera communities were significantly more
abundant, richer and more diverse in some years than in others (Fig. 3), tree age, canopy size,
and connectivity had no significant effect on this interannual variability since coefficients of
variation were unaffected by habitat characteristics (P>0.05).
2.3.3 Effects of tree age, canopy size, and connectivity on species composition
Beta diversity of Lepidoptera is mostly explained by the distance between trees (23%); tree
connectivity (4%) explained very little of the composition, and tree age and canopy size had no
significant effect on it (P>0.05) (Table 2). Consequently, the redundancy analysis decomposed
the total variation in alpha diversity of Lepidoptera and revealed that only 5% of this variation
was explained by environmental variables (Appendix A, Table A.5). Thus, no significant
relationship between species composition within each tree and tree characteristics (age,
canopy size, and connectivity) was detected (F3,19=1.425; p=0.214. Appendix A, Figure A.3).
When individually exploring the relationship between these variables and the relative
abundance of each family (i.e. the individuals recorded in a given family vs. the total of
recorded individuals), a significant linear regression is observed for Noctuidae and Pyralidae
families vs. tree age (P<0.05). The ratio of Noctuidae is greatest in younger trees, while the
opposite occurs in Pyralidae (Fig. 4a and 4b, respectively). Nonetheless, the regression
between tree age and the total abundance of these two families was significant only for
Pyralidae (Fig. 4c and 4d).

Chapter 2: Community assembly of Lepidoptera
30
2.4 Discussion
Our study demonstrates that the interplay of tree age, canopy size, and connectivity shapes
the species abundance, richness and diversity of the Lepidoptera community inhabiting holm
oak (Q. ilex) trees in a savannah-like landscape. In addition, it reveals the absence of the same
habitat effects (age, size, and connectivity) for species composition (alpha and beta diversity),
thereby highlighting the spatial distance between trees as the main – and almost only –
predictor of Lepidoptera species turnover. Overall, our models were able to explain a
significant fraction of the variance in Lepidoptera species abundance, richness and diversity, as
well as in species composition, and thus helps disentangle some of the habitat-related factors
that underlie the assemblage of the studied Lepidoptera community.
The community that developed in this savannah-like landscape consists mostly of Quercus spp.
specialist feeders and has a ‘tail’ of rare species that is characteristic of communities with low
evenness (Colwell, 2009). It is clearly dominated by Noctuids, especially the 4-cm wingspan
Catocala nymphagoga that appears very early in the succession process (i.e. it is very
abundant in the youngest trees). This Lepidoptera community also had great interannual
variability, with significant differences in species abundance, richness and diversity between
consecutive sampling years; as well, a considerable amount of variance was explained by the
random factor ‘year’. These two results reveal the high environmental stochasticity of the
system – inherent to Mediterranean regions (Lionello et al., 2006) – that our five-year data
series detected.
In terms of the hypothesis that predicted differences in species richness, alpha diversity
(Shannon’s diversity), and species abundance between holm oak trees of different age, canopy
size, and connectivity, our results reveal a significant and complex combined effect of habitat
age and structure on community attributes. The interaction between tree age and canopy
size – which results in greater species abundance, richness and diversity only in the smallest
trees as they age – can be explained by differential canopy encroachment in trees with
different architectures. Due to human management activities such as pruning, mature holm
oak trees of similar age can have very different canopy shapes and sizes. Pruning removes
multiple leaders and encourages the production of new shoots (Attocchi, 2013). In our study
area, pruned oak trees with better structured canopies and more new shoots will probably
encroach more easily over time than trees with more spreading canopies. Lepidoptera will
thus benefit from leaf clustering, either directly or indirectly, because it improves habitat
conditions (more food and an adequate microclimate) and decreases caterpillars’ vulnerability

Chapter 2: Community assembly of Lepidoptera
31
to predators (Marquis et al., 2002). LAI measurements (our proxy for canopy density and
biomass) reinforce this hypothesis since there was a significant positive slope of LAI with age
for the group of smallest trees that did not appear for the other size groups. In addition, the
time a tree has been standing in the fields may be of greater importance in smaller trees than
in larger ones because they are less ‘apparent’ to Lepidoptera and initial colonization by
Lepidoptera will thus place in a staggered fashion. Even though numerous studies have
demonstrated that oak foliage quality is a major determinant of the distribution and
abundance of oak herbivores (Feeny, 1970; Schultz & Baldwin, 1982; West, 1985; Faeth &
Bultman, 1986), we consider it to be highly unlikely that foliage chemical composition can
explain variability in Lepidoptera community parameters attributable to tree age given that
significant differences in nutritional quality and palatability are only expected between
individuals at different ontogenic stages (from saplings to mature and old trees) (Coley &
Barone, 1996; Basset, 2001). Furthermore, Gripenberg & Roslin (2005) found that leaf quality
variance within different parts of the same tree and between different trees varied little,
which means that Lepidoptera see trees as habitat ‘islands’ of roughly equal average quality.
At our study site, tree canopy size also interacts with tree connectivity, thereby giving greater
species abundance, richness and diversity in the largest trees as they become more connected,
probably because Lepidoptera perceive a site such as this as a patchy habitat and so colonize
connected trees more easily than isolated ones due to limitations in their dispersal abilities
(e.g. Nieminen, 1996; Doak, 2000; Ricketts et al., 2001). Even though both large and small tree
crowns become more visible and reachable as they grow larger, this increase in the
colonization probability, due to a better connectivity, only translates into greater species
abundance, richness and diversity in large trees as in the smallest trees resource availability
continues to be the main constraint to population dynamics (MacArthur & Wilson, 1967).
These results agree with those obtained in similar studies such as those by Müller & Goßner
(2007) and Gripenberg & Roslin (2005), which show that the proportion of herbivorous
specialists in a given oak increased significantly as the number of oak trees increased in the
surrounding area. Finally, the fact that Lepidoptera communities become more abundant and
richer in the youngest trees as they become more connected may be due to the existence of
colonization credits in the youngest isolated trees caused by random dispersal and differential
dispersal abilities (i.e. the species accumulation curve in the youngest trees will not have yet
reached the asymptote). These results suggest that in this archipelago of scattered trees the
species-area-isolation paradigm of island biogeography (MacArthur & Wilson, 1967) and
neutral models (Gyllenberg & Hanski, 1997; Hanski, 1999) is operating because we found

Chapter 2: Community assembly of Lepidoptera
32
greater species abundance, richness and diversity in older connected trees than in smaller
isolated ones as the community is constrained mainly by habitat area and the time the tree has
been standing (i.e. not long enough to have paid the colonization credit).
We found no ordination of the Lepidoptera species along either age, canopy size, or
connectivity ranges that could throw light on whether holm oaks of different age, canopy size,
and connectivity harbor different species assemblages. Similarly, the absence of tree age and
canopy size effects (P>0.05) and the small effect of tree connectivity on beta diversity (only 4%
variance explained) compared to the effect of the spatial distance between trees (23%
variance explained) suggest that in our study system the spatial distance between trees
overrides variation in their age, canopy size, and connectivity when determining Lepidoptera
species composition and spatial distribution. As a result, the local Lepidoptera species
assemblage will be strongly affected by random forces (Hubbell, 2001). However, for trees
hosting either Noctuids or Pyralids, tree age did partially explain the variance in the relative
abundance of these two families (24% and 16%, respectively). This relationship probably arises
due to differences in dispersal ability linked to body size (Kuussaari et al., 2014): i.e. Noctuidae,
due to their larger body sizes (Sekar, 2012), are often the first to colonize trees, whereas the
smaller Pyralids (e.g. 2-cm wingspan Phycita torrenti) take longer to reach the target patch and
therefore are less well represented in young trees. This hypothesis is supported both by the
lack of significance of tree age for the total abundance of Noctuidae (present at roughly equal
abundances irrespective of tree age) and its significance for the total abundance of Pyralidae
(that reach trees more gradually). Furthermore, this hypothesis is consistent with the
colonization time hypothesis that relates species richness with the time a patch has been
available for colonization (Borges & Brown, 1999).
This study is the first to address spatio-temporal patterns in the Lepidoptera community
assembly in Mediterranean holm oaks (Q. ilex) in a study system with a savannah-like
landscape. Overall, our results support the importance the interaction between habitat age
and structure has in the assembly of a Quercus-specialist Lepidoptera community where
connectivity effect is modulated by both tree age and size, two important factors that explain
differences in species abundance, richness and diversity. The fact that habitat variables poorly
explained alpha diversity and that beta diversity was mostly explained by the spatial distance
between trees supports the importance of dispersal-based assemblies in this community.
Likewise, given that a considerable proportion of variance remained unexplained by our
models, niche-assembly processes may also be relevant. This paper provides guidelines for
managing holm-oak savannah-like landscapes for diversity conservation and, for example,

Chapter 2: Community assembly of Lepidoptera
33
underlines the importance of maintaining old, large, and well-connected trees as important
refuges for Lepidoptera. Moreover, these conservation efforts are likely to benefit other taxa
that prey on Lepidoptera or share similar habitat requirements, thereby contributing to the
restoration of forest ecosystem functioning.
Acknowledgements
This study was funded by the MONTES (CONSOLIDER PII1C09-0256-9052), NOVFORESTS (CGL-
2012-33398), and PLAGANADO (AGL2014-54739-R) projects of the Spanish Ministry of
Economy and Competitiveness, and the project PII1C09-0256-9052 financed by the Regional
Government of Castilla-La Mancha and the European Social Fund. As well, HR was funded by a
pre-doctoral grant (BES-2013-065741) within NOVFORESTS, and RB was funded by a contract
from the Atracción de Talento Investigador Programme (Gobierno de Extremadura).
Fig. 1. Upper image: orthoimage of the study site (Huecas) in 1957. Lower image: orthoimage
of the study site in 2014.

Chapter 2: Community assembly of Lepidoptera
34
Fig. 2. Predicted effects (mean) of interactions between (1) tree age and tree canopy size; (2)
tree connectivity and tree canopy size; and (3) tree connectivity and tree age on (a) species
abundance (log scale), (b) species richness, and (c) Shannon’s Diversity. Predicted values are
based on the fixed effects of the best model (see Appendix A). Tree canopy size categories:
Small (12–43 m2), Medium-size (43–79 m2), Large (79–104 m2). Tree age categories: Young
(20–43 years), Middle-aged (43–56 years), Old (56–74 years). Units: years, square metres and
square metres, for tree age, tree canopy size and tree connectivity respectively.

Chapter 2: Community assembly of Lepidoptera
35
Table 1. Results of best mixed-effects linear models for species abundance, richness and
diversity. Values in bold indicate significance at α of 0.05.
Value SE DF t-value P
Species abundance
(Intercept) 2.513 0.213 103 11.791 0.000
Size 0.055 0.103 103 0.532 0.596
Age 0.065 0.131 103 0.498 0.619
Connectivity 0.192 0.118 103 1.632 0.106
Size: Age -0.280 0.106 103 -2.637 0.010
Size: Connectivity 0.438 0.119 103 3.665 >0.001
Age: Connectivity -0.277 0.110 103 -2.528 0.013
Species richness
(Intercept) 4.590 0.562 103 8.162 0.000
Size 0.223 0.244 103 0.913 0.363
Age -0.026 0.310 103 -0.084 0.933
Connectivity 0.729 0.278 103 2.619 0.010
Size: Age -0.625 0.251 103 -2.488 0.014
Size: Connectivity 0.700 0.282 103 2.484 0.015
Age: Connectivity -0.517 0.259 103 -1.996 0.049
Shannon’s Diversity
(Intercept) 3.508 0.392 103 8.951 0.000
Size 0.105 0.167 103 0.629 0.531
Age 0.031 0.211 103 0.146 0.884
Connectivity 0.466 0.190 103 2.457 0.016
Size: Age -0.359 0.171 103 -2.096 0.039
Size: Connectivity 0.386 0.193 103 2.004 0.048
Age: Connectivity -0.307 0.177 103 -1.736 0.086

Chapter 2: Community assembly of Lepidoptera
36
Fig.3. Boxplot illustrating species log-transformed abundance, richness and diversity
(Shannon’s Diversity) (1, 2 and 3 respectively) per tree in five sampling years. Different letters
above and under bars indicate significant differences (multiple comparison test following
Kruskal–Wallis) in the species abundance, richness and diversity of Lepidoptera per tree. Box
plots show minimum, lower quartile, median, upper quartile and maximum values.
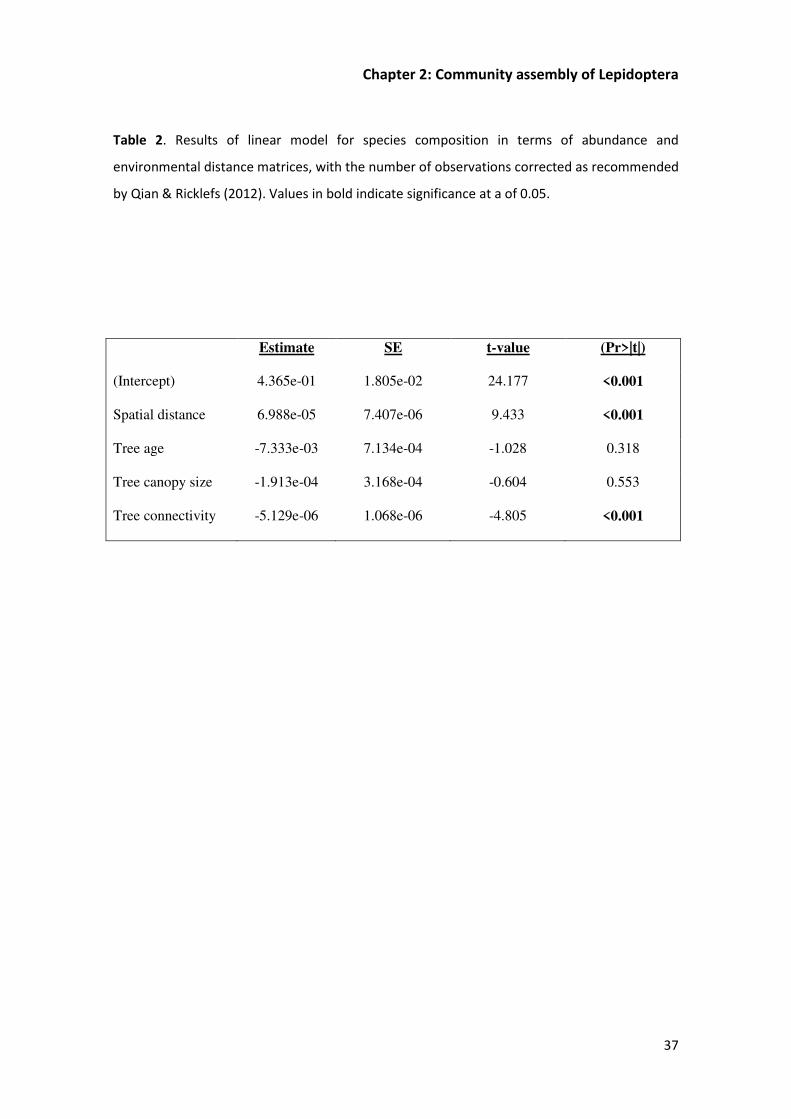
Chapter 2: Community assembly of Lepidoptera
37
Table 2. Results of linear model for species composition in terms of abundance and
environmental distance matrices, with the number of observations corrected as recommended
by Qian & Ricklefs (2012). Values in bold indicate significance at a of 0.05.
Estimate SE t-value (Pr>|t|)
(Intercept) 4.365e-01 1.805e-02 24.177 <0.001
Spatial distance 6.988e-05 7.407e-06 9.433 <0.001
Tree age -7.333e-03 7.134e-04 -1.028 0.318
Tree canopy size -1.913e-04 3.168e-04 -0.604 0.553
Tree connectivity -5.129e-06 1.068e-06 -4.805 <0.001

Chapter 2: Community assembly of Lepidoptera
38
Fig. 4. Relative mean abundance of Noctuidae (a), relative mean abundance of Pyralidae (b),
total mean abundance of Noctuidae (c) and total mean abundance of Pyralidae (d) per tree
versus tree age. Regression equation, adjusted R2 (Adj.r2) and significance of tree age (P) are
given in bold.

Chapter 3: The role of host genetics, ontogeny and location on herbivory
39
Chapter 3: Disentangling the effects of host genetic identity, ontogeny
and spatial distribution in insect herbivory in expanding oak forests
RUIZ-CARBAYO, H., PIBO, J., BONAL, R., JAMES, P., HAMPE, A., ESPELTA, J. M.
Manuscript under preparation
Abstract
Herbivory is expected to be influenced by host characteristics such as genetic characteristics,
ontogeny and spatial location. However, the effects of these three factors have been seldom
explored altogether neither their interaction. We investigated their impact on herbivory by
insects on Holm oak (Quercus ilex L.) in spontaneously established forests after cropland
abandonment. These naïve forests are an ideal system to study the assembly of plant-animal
interactions as their genetic and age structure has not been yet significantly altered by forest
management. We sampled Q. ilex individuals from seedlings to mature trees within forest
patches and determined their location, age, genetic variability by means of SNP amplification
and leaf herbivory damage. We identified two direct factors influencing herbivory: i.e. 5
genetic clusters with differences in susceptibility and a significant edge effect with damage
being greater at the forest patch core compared to the edge. Conversely to the previous
factors, oak ontogeny did not show any significant effect per se but in interaction with intra-
specific connectivity: i.e. saplings and sub-dominant trees, but not seedlings, had lower leaf
damage in the vicinity to mature trees. Our findings indicate that some host characteristics (i.e.
genetics and tree location in the forest patch) may have direct and independent effects on
herbivory while associational resistance, potentially mediated by plant-plant communication
or differences in plant apparency, only occurs above a certain host size. In addition, these
results shed light on how plant-animal interactions are assembled in new habitats and their
potential consequences for forest expansion.
Chapter 3: The role of host genetics, ontogeny and location on herbivory
40
Keywords: edge effects, herbivory, holm oak, new forests, plant-insect interaction
3.1 Introduction
Plant-animal interactions are among the main processes shaping biodiversity (Valiente-Banuet
et al. 2015). As interactions with herbivores have great impact on the survival, reproduction
and recruitment of plants (Maron & Crone, 2006), they can largely affect ecosystem dynamics
and services (Maguire et al. 2015). The intensity of herbivory in a host is modulated by intrinsic
and extrinsic factors. Among intrinsic traits, genetic identity (Castagneyrol et al. 2012) and
ontogeny (Moreira et al. 2017) have been observed to be relevant characteristics influencing
host susceptibility. In addition, herbivory may be also mediated by extrinsic factors such as the
spatial location (associational effects) of the host from conspecifics (Fernandez-Conradi et al.
2017), heterospecifics (Guyot et al. 2016), or in relation to the habitat characteristics (i.e. core
area vs edge) (Régolini et al. 2014).
Susceptibility to herbivory can vary among host genotypes owing to differences in the
expression of phenotypic traits affecting insect feeding preference such as architecture,
trichome density, leaf toughness, nutrient or secondary chemical content (Barbour et al.
2015). Because herbivory can play a strong selective pressure, it has been suggested that
natural selection may act on particular loci maintaining allele combinations that maximize
fitness of individuals by providing these defense traits (Züst and Agrawal 2016). In this line,
some studies have found a positive relationship between inter-individual resistance to
herbivory and the number of heterozygous loci (Mitton and Jeffers 1989). However, the
degree of herbivory damage suffered by a particular individual may not only depend on its
particular genetic characteristics but be also influenced by the genetic diversity of neighbours
(Barbosa et al. 2009; Barton et al. 2015). Yet, there is still a large disagreement among studies
in the direction and strength of these associational genetic effects on herbivory. Genetic
Chapter 3: The role of host genetics, ontogeny and location on herbivory
41
diversity of conspecific neighbours has been observed to increase susceptibility to herbivory by
increasing host location and spill over of herbivores (Castagneyrol et al. 2012), to have neutral
effects (Moreira et al. 2014) or increase resistance to damage owing to the negative impact in
some groups of insects (e.g. chewing herbivores and gall makers in Barton et al. 2015). In
addition to genetics, inter-individual differences in herbivory may be associated with shifts in
defense traits during ontogeny (from seedlings to mature plants). Two hypotheses have been
proposed to explain the potential variations that physical (e.g. leaf toughness) or chemical
defenses (e.g. alkaloids) may experience throughout the lifespan of a plant: i.e. the plant-age
and the growth-differentiation balance hypotheses. The plant-age hypothesis predicts a larger
investment in defenses by young plants compared to older ones due to the higher risk and
more negative effects they may suffer from herbivory owing to their reduced size (Kotanen
and Rosenthal 2000). In contrast, based on the existence of resource constraints, the growth-
differentiation balance hypothesis states that mature plants will be better defended owing to
the existence of a growth vs. defense trade-off in the young ones (Herms and Mattson 1992).
Interestingly, as for the role of genetic diversity on herbivory damage, these hypotheses have
not been conclusively confirmed as it has been observed that plant defense traits may increase
(e.g. Schaffner et al. 2003; Elger et al. 2009) or decrease (e.g. Goodger et al. 2006) during
ontogeny. Consequently, some studies have reported a reduction in the susceptibility to
herbivory with ageing (Moreira et al. 2017) while others have reported a larger damage in
juveniles (Barton and Hanley 2013).
Contrasting results in studies analysing the role of genetic diversity and ontogeny in herbivory
might arise from the fact that there have been little attempts to analyse both factors
altogether in natural populations neither to evaluate also their interaction with plant location.
Indeed, extrinsic factors such as the spatial distribution of hosts may also greatly affect
herbivore’s activity, by altering the likelihood of a plant to be damaged according to the
Chapter 3: The role of host genetics, ontogeny and location on herbivory
42
characteristics of neighbours. Associational resistance or susceptibility to herbivory are plant-
plant interactions in which herbivory rates may respectively decrease or increase owing to the
influence of defensive or appealing characteristics of the neighbouring plants (Barbosa et al.
2009). Plants in the nearby may either act as a deterrent, repelling herbivores from the area,
or as a sink because of its greater palatability, leading in both cases to associational resistance
for the focal plant. However, plants acting as sinks may also occasionally lead to associational
susceptibility, as insect populations growing on suitable hosts often disperse to nearby trees.
Interestingly associational effects have been observed to exist related to both characteristics:
i.e. genetics and ontogeny. On the one hand, herbivory in a focal plant may depend on genetic
characteristics of plants in the vicinity influencing palatability, volatile signals or differences in
architecture (Marquis et al. 2002; Karban et al. 2006; Fernandez-Conradi et al. 2017). On the
other hand, the developmental stage of a plant may influence its “apparency” compared to
neighbours and, ultimately affect herbivory damage (Boege 2005; Castagneyrol et al. 2013;
Moreira et al. 2017). Unfortunately, little research has been conducted on this sort of potential
interactions between genetics, ontogeny and plant-plant location. In addition to these effects,
host susceptibility may change according to the position in the habitat (e.g. core vs. edge),
owing to changes in leaf palatability (Onoda et al. 2008) driven by differences in environmental
characteristics (e.g. Guirado et al. 2006), the ability of herbivores to detect the host (Régolini
et al. 2014) or herbivore abundance influenced either by environmental conditions (McGeoch
and Gaston 2000) or by the presence of insect predators (Skoczylas et al. 2007) or parasitoids
(Pare and Tumlinson 1999). Yet, there seems to be no consensus of forest edge effects on
plant-herbivore interaction as some studies have reported a greater incidence of herbivory in
forest edges because generalist herbivores benefit from favourable microenvironmental
conditions, greater availability of high-quality food, and a weaker control from natural
predators while others indicate less herbivory damages at the forest edge (e.g. see a review by
Wirth et al. 2008). Once again, differences among studies might be partly arise from neglecting
Chapter 3: The role of host genetics, ontogeny and location on herbivory
43
the other above-mentioned traits influencing herbivory: i.e. host genotype, ontogeny and their
interaction (but see Barrett and Agrawal 2004).
The present study aims at disentangling the effects of intra-specific genetic variability, plant
ontogeny, and host spatial distribution on leaf herbivory in Holm oak (Quercus ilex L.;
Fagaceae) individuals within forest patches spontaneously established on abandoned
croplands. These “new oak forests” offer an ideal study system to analyze the referred
questions as their community composition, genetic characteristics and size structure has not
been yet significantly altered by human influence (e.g. forest logging). Moreover, while there is
abundant literature about the effects of forest fragmentation in plant-animal interactions, it
has seldom been explored how they become assembled in new habitats as those originated by
recent land use changes (e.g. Basnou et al. 2016) and how these interactions can influence the
process of forest expansion itself (but see Ruiz-Carbayo et al. 2018 for granivorous insects).
Previous studies have provided evidences that in these “new oaks forests” the community of
insect herbivores can change from individual to individual depending on their age, canopy size
and conspecifics connectivity (Ruiz-Carbayo et al. 2017) and other intrinsic host traits (e.g. for
granivorous insects: seed size in Ruiz-Carbayo et al. 2018 and seed number in Bogdziewicz et
al. 2018). In light of these results we predict that herbivory will be mediated by the interaction
among genetics, ontogeny and location. We hypothesize that: (i) herbivory extent will be
modulated by genetic variability, being higher in homozygous oaks (ii) younger trees will suffer
from more intense damage compared to older trees because of their lower size and resource
allocation to produce defenses; and (iii) both genetic and ontogeny effects will interact with
the host location, with increasing herbivory in the vicinity to more mature trees and far from
forest edges due to higher herbivore spillover and more suitable environmental conditions in
the forest interior.
3.2 Material and Methods
Chapter 3: The role of host genetics, ontogeny and location on herbivory
44
3.2.1 Study area
This study was carried out in the Vallès lowland (Barcelona, Spain, 41° 33′N, 2° 2′E) (see Fig.1).
Climate in the region is Mediterranean, annual rainfall averages 650 mm and mean
temperatures range from 6°C in winter up to 23°C in summer. The Vallès lowland offers an
ideal scenario to conduct spatiotemporal studies on plant-animal interactions because it
includes a large number of new forest patches established in former croplands still embedded
in a matrix of agricultural areas and pastures (Ruiz-Carbayo et al., 2018). Many of these forest
patches have been successfully colonized by Q. ilex (Guirado et al. 2008) with the presence of
different life-history stage classes: i.e. adult trees, saplings and seedlings. Q. ilex is a
widespread oak species in the Mediterranean Basin (Terradas 1999). Previous studies have
reported that this species host a large array of specialist phytophagous insects predating upon
leaves including more than 25 Lepidoptera species (see Ruiz-Carbayo et al. 2017 for a
comprehensive species list). Additionally, in this species a high allelic richness has been
reported, and this genetic variability could influence leaf palatability among genotypes and,
therefore, affect also host selection by herbivore insects (see Schädler et al., 2003).
3.2.2 Experimental design and sampling
By means of comparing 1956- and 2005-orthoimages available for all Barcelona province, we
identified forest patches emerged after cropland abandonment in 1956 (hereafter “new
forests”), and selected three of them with a mean distance of 27 Km among them (hereafter
Cardedeu, Martorell, Cervelló). In order to carry out a demographic sampling as balanced as
possible, we established five size categories that may also roughly correspond to different
developmental classes (Class 1: Seedlings less than 20 cm in height. They are commonly
seedlings recently established still bearing their cotyledons; Class 2: Seedlings 20-50 cm in
height. Normally, two or more years old seedlings fully independent from the cotyledon
Chapter 3: The role of host genetics, ontogeny and location on herbivory
45
reserves; Class 3: Saplings between 50-130 cm in height. Individuals moving from the seedling
to the sapling stage often requiring environmental conditions suitable for establishment (e.g.
increase in PAR) to continue their development; Class 4: Saplings more than 130 cm height but
less than 5 cm dbh. Suppressed or sub-dominant saplings and, Class 5: individuals with dbh
equal or greater than 5 cm. Adult trees with fully expanded canopies in the top layer of the
forest (see Espelta et al., 1995, Zavala et al., 2011 for more information about the
characteristics of these stage classes). We sampled a total of approximately 200 individuals in
each site along parallel transects (see Appendix B, Table B.1), and a sub-sample of ca. 30 leaves
were randomly gathered from each individual. Each individual was geolocated using a global
positioning system (GARMIN GPSMAP 62st). For an accurate determination of the age, we
harvested seedlings and saplings to get a trunk disc, or extracted a core from the trunk using a
Pressler borer in adult oaks in order to apply the tree-ring dating technique later on the
laboratory (see Gené et al., 1993).
To assess leaf herbivory damage, once in the laboratory we allocated each randomly selected
leaf into a category of damage according to the percentage of area missing caused by leaf
chewing by the herbivore caterpillars (category C0 = 0%, C1 = 1–5%, C2 = 6–25%, C3 = 26–50%,
C4 = 51–75%, C5 = 76–100%). The estimation of the missing area was performed by the naked
eye always by the same observer. Then, we quantified the herbivory pressure exerted by
caterpillars upon each tree by calculating a herbivory index (H) after (Benitez-Malvido et al.
1999) as follows:
� = � ��(��)/�
Where i is the damage category, ni is the number of leaves in the ith damage category, Ci is the
midpoint of each category (i.e. C0 = 0%, C1 = 3%, C2 = 15.5%, C3 = 38%, C4 = 63%, C5 = 88%),
and N is the total number of leaves sampled per tree. In an attempt to standardize the value of

Chapter 3: The role of host genetics, ontogeny and location on herbivory
46
herbivory across individuals with different size (from seedlings with only a few leaves to
mature trees with voluminous crowns) we weighted the herbivory index by the diameter-at-
breast height (dbh).
3.2.3 Data analysis
Connectivity to mature oaks of every individual in the sample (from seedlings to mature oaks)
was estimated based on the Euclidean distance matrix calculated among individuals within the
same forest patch using the distance function of the package ecodist. We chose the simplest
Euclidean distance because of the short distance to be covered by insects from one tree to
another (always <150 m) and the fact that dispersal is considered at the intra-patch level, with
a homogeneous environment. For each individual, we averaged distances of the matrix to
every mature tree within the patch, and used the inverse of this new variable as a proxy of
connectivity. For the calculation of the minimum distance to the forest edge, we rasterized the
vector layers containing the geolocation of the trees and the polygons of the sampling patches
using packages rgeos, rgdal and raster in R, version 3.4.1. (R Core Team 2017). On the resulting
raster layer we assigned null values to all forest pixels as well as a value of 1 to every non-
forest pixel. We then calculated the minimum distance from the cell containing the oak
coordinates, to the nearest non-forest cell using the gridDistance function within the raster
package.
To determine the genetic characteristics of individuals (i.e. heterozygosity percentage, loci
under selection, and genetic clusters) we used SNPs (Single Nucleotide Polymorphisms)
information for all oaks. 66 SNP loci were identified, combined into a multiplex and sequenced
on an iPLEX Gold genotyping kit (Sequenom, San Diego, CA, USA) at the Genomic and
Sequencing Facility of Bordeaux (France) following the procedure described in (Chancerel et al.
2013). In order to obtain the heterozygosity percentage of each individual we divided the

Chapter 3: The role of host genetics, ontogeny and location on herbivory
47
number of heterozygous loci by the total number of amplified loci and to identify candidate
genes under selection that might be related to herbivory resistance/susceptibility, we used the
software Lositan (Antao et al. 2008). The rationale behind the genetic model used by this
program is the assumption of unusual low or high levels of heterozygosity in loci that have
been influenced by natural selection. This differentiation can be quantified using the statistic
FST and visualized in a plot of FST vs. heterozygosity using a null distribution generated by the
genetic model (Beaumont and Nichols 1996). Genetic origin of each oak was determined by
means of the find.clusters function of the adegenet package (Jombart et al. 2010). This
function transforms data using a principal component analysis (PCA) and then, runs successive
K-means with an increasing number of clusters (k). The goodness of fit measure selected was
the Bayesian Information Criterion (BIC). The identified genetic clusters (5) were then included
in the linear mixed models as a 5-level factor in order to test the effect of intra-specific genetic
variability on herbivory patterns. Finally, to assess genetic structure partitioning among and
within oak populations we performed analyses of molecular variance (AMOVAs) using
ARLEQUIN software (Excoffier et al. 2005).
3.2.4 Statistical analysis
Prior to run the statistical analyses we checked our continuous predictors (distance to mature
oaks, minimum distance to forest edge, oak age and percentage of heterozygosity) for
collinearity using Pearson’s correlation coefficients. As the highest r2 value was found for oak
age and % heterozygosity (r2 = .60), we did not drop any explicative variable from the analysis.
Looking for the best goodness of fit, we built both, a generalized linear mixed model including
the sampling site as a random term, as well as a simpler generalized linear model with no error
structure. Since the AICc of the null model including random structure was lower in more than
two units compared to the AICc of the generalized linear model (AICcglmm= 4148.633;
Chapter 3: The role of host genetics, ontogeny and location on herbivory
48
AICcglm= 4166.624) we performed generalized linear mixed models to test the effects of oak
genetic variability, age and spatial distribution on the herbivory pressure including forest patch
as a random factor. Once the presence/absence of random structure within the null model was
stablished, we built a saturated model with the function nb.glmer as implemented in the R
package lme4 with the weighted herbivory index as a response and all fixed effects (genetic
cluster, % heterozygosity, oak age, minimum distance to forest edge and connectivity to
mature oaks) plus second-degree interactions. Model selection was performed based on the
second-order Akaike Information Criterion (AICc) and adjusted R2 (Appendix B; Table B.3).
The genetic structure of the oak populations was investigated by means of a Discriminant
Analysis of Principal Components (DAPC) within the adegenet package. DAPC allows linear
combination of alleles to perform as discriminant functions, therefore computing allele
contributions and allowing inference of structure among genetic clusters. All data treatment
and data statistical analyses were performed in R, version 3.4.1. (R Core Team 2017).
3.3 Results
The main characteristics of the forest patches surveyed and the level of herbivory per stage
class are summarized in Table 1. The three forests showed a similar age structure (i.e. from 2
yr seedlings to 20-25 yrs adult trees) and a similar level of heterozygosis in the different stage
classes (c.a. 20-25% except the highest values of the seedling class in Cardedeu). Concerning
herbivory, in all forest patches the herbivory index never exceeded 15 and decreased in elder
stage classes (Table 1). Following the maximum parsimony principle, the number of clusters
that best explained the genetic structure present in our study sites were five clusters with a
BIC value of 1551.524 (Appendix B, Table B.1). The high proportion of successful reassignment
(based on the discriminant functions) of individuals to their original clusters, indicated clear-
cut clusters. Concerning the three forest patches, Clusters 1, 2 and 3 were present in all three
Chapter 3: The role of host genetics, ontogeny and location on herbivory
49
study sites (Cardedeu, Martorell and Cervelló), while cluster 4 was more abundant in Martorell
and specially Cervellò. Finally, cluster 5 was exclusively present in the most distant study site,
Cardedeu (except for a single individual in the other two sites). According to the AMOVA
analysis, there were significant genetic differences attributable to age category (Appendix B,
Table B.2). Nevertheless, in Cervellò and Martorell the percentage of variation in the number
of different alleles among oaks of different age was less than 0.1%. Conversely, in Cardedeu, a
significant amount of genetic structure was found among age categories within the patch
(29.8%), as a consequence of the high values of pairwise FST (genetic differentiation) between
the youngest seedlings (Stage class 1) and the rest of classes (pairwise FST ≥ 0.4, p<0.001).
The best model for herbivory intensity was the model including genetic cluster, oak age,
minimum distance to forest edge, connectivity to mature oaks, besides the interaction of age
and connectivity (Supplementary material Appendix 2, Table 3). Best model revealed the
importance of intra-specific differences in genetic lineages on herbivory resistance, with
genetic cluster 3 (present in the three forest patches) being significantly less affected by
herbivores than cluster 1 and 5 (z = -3.101; P = 0.0136 and z = 2.928; P = 0.0235, respectively;
see Figure 2). Moreover, Lositan analysis, revealed the existence of four loci under positive
selection (outlier loci that show lower FST compared to neutral expectations) and nine under
balancing selection (excessively high FST), neutral and positive selection (Table 2), supporting
the importance of the intra-specific genetic variability.
Concerning distance to forest edge, oaks located at the core of the forest patch exhibited more
herbivory damage than oaks at the edge (z = 2.185; p < 0.0289). In addition, to this effect of
location there was a significant interaction between oak age and connectivity to mature oaks
(z = -3.931; p < 0.001), revealing lower levels of herbivory exclusively in elder stage classes as
they were more connected to mature oaks (Fig. 3); however this interaction needs careful
interpretation since most data are in the lower extreme of the connectivity gradient.

Chapter 3: The role of host genetics, ontogeny and location on herbivory
50
3.4 Discussion
By analyzing the combined effects of genetic variability, ontogeny, and spatial distribution of
hosts in the herbivory susceptibility of Q. ilex individuals, we could detect that genetic
differences had a direct effect on the damage by herbivore insects, irrespective of plant
developmental stage and plant to plant distance, while the effect of these two other factors
resulted in an associative resistance to herbivory in individuals closer to mature oaks but only
above a certain developmental stage threshold (interaction age x distance). In addition,
irrespective of genetic characteristics and size, herbivory intensity was directly influenced by
the distance of the focal plant to the forest edge, suggesting that the shape and size of these
recently established forest patches may be highly relevant in driving the outcome of plant-
insect interactions (see for the composition of the Lepidopteran community Ruiz-Carbayo et al.
2017) and, ultimately, for the dynamics of Q. ilex establishment (see for acorn predation Ruiz-
Carbayo et al. 2018).
The contrasting herbivory levels observed among the identified genetic clusters suggests that
genetically-based chemical and/or structural traits likely affect palatability and susceptibility to
herbivores within these oak populations (see Ito and Ozaki 2005; Castagneyrol et al. 2012 for
other Quercus spp. and Silfver et al. 2009 for birch). Therefore, insect herbivory might be an
important pressure favoring a particular genetic cluster (i.e. Number 3) in the assembly of
these new oak populations and their future genetic composition. Population genetics theory
predicts an increase in the fitness of individuals carrying a higher number of heterozygous loci,
and many empirical studies have reported a positive effect of genetic variation on plant
resistance to herbivory (Mopper et al. 1991; Bello-Bedoy and Núñez-Farfán 2011). However,
contrary to this prediction, herbivory resistance in Q. ilex was not related to the percentage of

Chapter 3: The role of host genetics, ontogeny and location on herbivory
51
heterozygosity, since this variable was not retained in the most adequate model in our study.
This is corroborated by the low number of loci under balancing selection found, that is, loci
with unusual high levels of heterozygosity. Since most of the loci considered for this study have
been under neutral selection, there may be no advantages, either physiological or energetic
associated to being either homozygous or heterozygous against herbivore’s attack. Still, the
genetic model identified a few candidate loci for herbivore resistance under selection
(Appendix B, Fig. B.1), either balancing or positive, that would help explaining the differences
among genetic clusters on plant susceptibility to herbivores.
We found significant changes in herbivory damage of Q. ilex leaves depending on plant
developmental stage as previously described for other species (Del-Val and Dirzo 2003; Boege
and Marquis 2005; Moreira et al. 2017). Yet developmental stage, only modified herbivory
intensity in interaction with tree connectivity to mature oaks, indicating that the predictions
made by the plant-age hypothesis or the growth-differentiation balance hypothesis may be
strongly context-dependent and change. Previous studies suggest that in the case of
associational susceptibility among neighbors due to herbivore spillover as part of their host-
seeking behavior (Plath et al., 2012), whereas associational resistance hypothesis argues that
emission of chemical compounds (e.g. VOCS) might promote attraction of predators and
parasitoids and favor defense reactions in con-specific neighbor individuals (e.g. Barbosa et al.,
2009). In the case of our new Q. ilex forests, the observation of oaks being less affected by
herbivores nearby mature trees supports the associational resistance hypothesis, suggesting
some sort of short-distance plant-plant communication mechanism from elder individuals, as
previously reported by other authors (see Heil 2014 for a review on plant-plant
communication). For example, Dolch & Tscharntke (2000) proved that defoliation of alder
(Alnus glutinosa L.) by leaf beetles caused a local change of herbivore’s attack on nearby
plants, but especially on those located within a few meters of the damaged tree. In a similar

Chapter 3: The role of host genetics, ontogeny and location on herbivory
52
study, sagebrush plants (Artemisia tridentata Nutt.), experienced less damage by herbivores
only within 60 cm of plants subjected to leaf experimental clipping (Karban et al. 2006). Yet,
the fact that the observed associational resistance of individuals when established close of
mature oaks did mostly occur above a certain developmental stage (Connectivity to mature
oaks * Oak age interaction in Tables 3), suggest that in smaller oaks the main characteristics
driving their higher susceptibility to herbivory owing to more palatable leaves in a less dense
canopy (see Ruiz-Carbayo et al. 2017 for similar results in terms of abundance of folivorous
Lepidoptera in oaks related to age and connectivity, Fenner et al. 1999; Pearse 2011).
However, the fact that we know neither the identity of the insect herbivores causing the
damage nor their density does not discard that the observed differences in herbivory among
developmental stage might be caused by differences in “apparency” or by hosting a distinct
community of herbivores (see Castagneyrol et al. 2013; Haase et al. 2015).
A third relevant result is that herbivory damage in our new forest patches was higher in trees
standing at the forest core compared to those located near the edges (see also McGeoch &
Gaston, 2000, Skoczylas et al., 2007; Régolini et al. 2014). Several alterations in microclimatic
conditions in forest edges such as reduction in air humidity, greater temperature variability,
higher light exposure, and wind turbulences, may affect herbivore activity when compared
with conditions at the forest interior (Laurance et al., 2002, ). Moreover, differences in
microclimatic conditions in forest edges, may result in higher leave toughness and lower leaf
nutritional quality (Baraza et al., 2004; Barber and Marquis 2011) in comparison to more
shaded leaves, especially in plants with carbon-based defenses (Dudt & Shure, 1994) In
addition, edge effects are also expected to alter enemy abundance or behavior, by means of
parasitoid signaling by VOC emission (Staudt and Lhoutellier 2007) that may be more intense
in oaks benefiting from full-light regimes and consequently, at forest edges. Finally, in the case
of larger predators, such as insectivorous birds, edges would provide maximum access to prey,

Chapter 3: The role of host genetics, ontogeny and location on herbivory
53
making foraging for Lepidoptera larvae much easier compared to foraging at forest interior
(Skoczylas et al. 2007).
Even though deforestation is still a major threat for biodiversity conservation, spontaneous
establishment of forests in former cropland areas is a widespread phenomenon in some
regions of the Northern Hemisphere (Meyfroidt and Lambin 2011). As plant-animal
interactions are particularly affected by landscape changes there have been reported serious
impacts on them owing to differential extinction of the concerned species mediated by habitat
loss (Spiesman and Inouye 2013). Conversely, it is much more unknown how these interactions
are assembled in new habitat patches, and how they can drive the dynamic of habitat recovery
(see Basnou et al., 2016). Yet, recent studies have already demonstrated the importance of
host traits at the individual level in modulating plant-insect interactions assembly in new
expanding habitats. For example, Ruiz-Carbayo et al., 2017 reported complex interactions
among oak age, size and connectivity in the Lepidoptera community present in oaks
established in agricultural landscapes while Ruiz-Carbayo et al., 2018 revealed higher acorn
predation driven by changes in acorn size in oaks highly connected in new established forest
patches. In that sense, our results underscore the straightforward importance of Q. ilex
genetics and location within the patch in modulating herbivory by insects in newly established
patches. In addition, we provide evidences of the existence of associational resistance
mediated by the interactive effects of developmental stage and connectivity and an influence
of the forest shape/size with lower herbivory at the forest edge. Future research should be
aimed to assess whether the differences in herbivory reported in this study may help to
explain why some species, as Q. ilex, exhibit a somehow arrested recruitment in new
established Mediterranean forests in comparison to other species that have already exhausted
their colonization credits (Basnou et al., 2016, Stricker & Stiling, 2012).

Chapter 3: The role of host genetics, ontogeny and location on herbivory
54
Acknowledgements
We are grateful to Dr. Jemery Larroque, Julian Wittische and Dr. Víctor Granda for their
statistical advice. We also thank Daiana Tourne, Jennifer Sauri and Raquel Ubach for their help
with the spatial treatment of data in ArcGIS. This research was supported by the
FORASSEMBLY (CGL2015-70558-P), COLONOAK and SPONFOREST (APCIN_2016_0174).
Furthermore, HR was funded by a pre-doctoral grant (BES-2013-065741) and the
complementary grant for short internships (EEBB-I-17-12542) of the Spanish Ministry of
Economy and Competitiveness, and RB was funded by a contract from the Atracción de
Talento Investigador Programme (Regional Government of Extremadura).
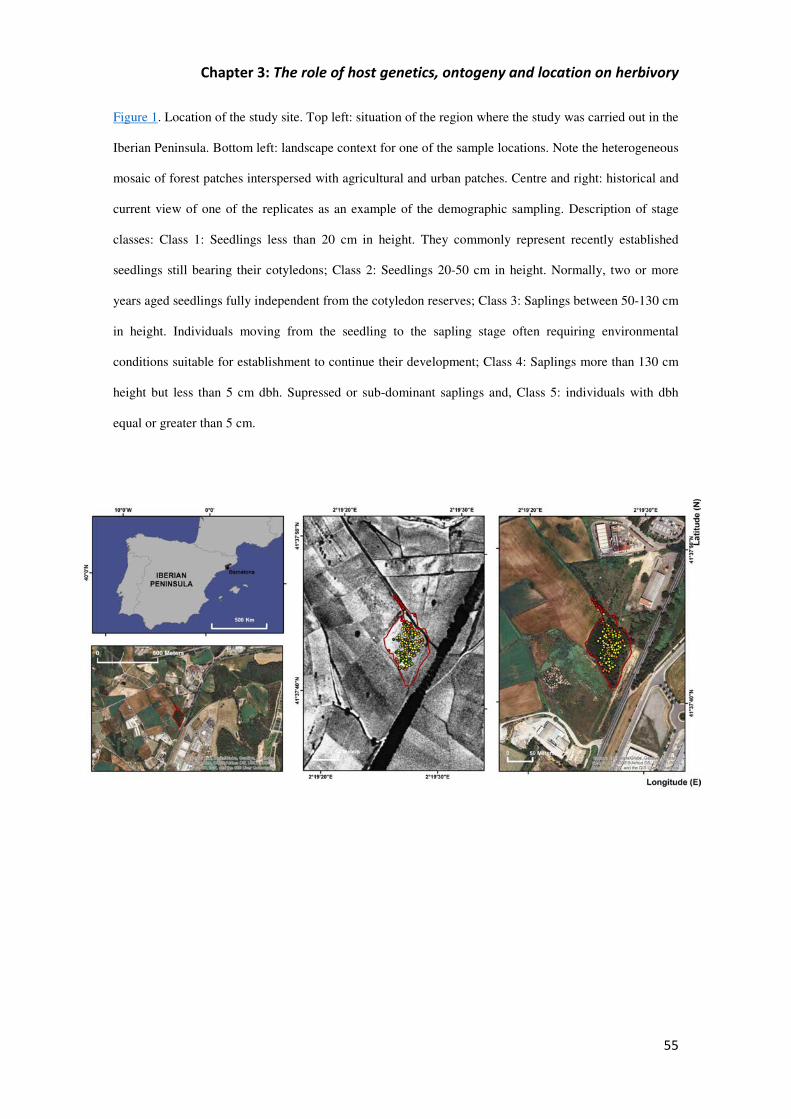
Chapter 3: The role of host genetics, ontogeny and location on herbivory
55
Figure 1. Location of the study site. Top left: situation of the region where the study was carried out in the
Iberian Peninsula. Bottom left: landscape context for one of the sample locations. Note the heterogeneous
mosaic of forest patches interspersed with agricultural and urban patches. Centre and right: historical and
current view of one of the replicates as an example of the demographic sampling. Description of stage
classes: Class 1: Seedlings less than 20 cm in height. They commonly represent recently established
seedlings still bearing their cotyledons; Class 2: Seedlings 20-50 cm in height. Normally, two or more
years aged seedlings fully independent from the cotyledon reserves; Class 3: Saplings between 50-130 cm
in height. Individuals moving from the seedling to the sapling stage often requiring environmental
conditions suitable for establishment to continue their development; Class 4: Saplings more than 130 cm
height but less than 5 cm dbh. Supressed or sub-dominant saplings and, Class 5: individuals with dbh
equal or greater than 5 cm.

Chapter 3: The role of host genetics, ontogeny and location on herbivory
56
Figure 2. Leaf damage by lepidoptera on different Q. ilex genetic clusters identified by successive K-
means. Boxplots represent median, 25th, and 75th percentiles, respectively. Different letters mean
significant differences between genetic clusters. Means are represented by empty dots while outliers are
depicted as black dots.
Figure 3. Interaction plot for the effects on herbivory damage of oak developmental stage (i.e. age) of the
focal plant and the connectivity to mature oak trees. Connectivity (m2), age (years) and herbivory index
(dimensionless) are centered and scaled. Herbivory scale ranges from blue (low herbivory) to red (high
herbivory) colors.

Chapter 3: The role of host genetics, ontogeny and location on herbivory
57
Table 1. Summary table of oak characteristics and herbivory damage per stage class at the three forest patches (Cardedeu,
Martorell and Cervelló). Description of stage classes: Class 1: Seedlings less than 20 cm in height; Class 2: Seedlings 20-50 cm in
height; Class 3: Saplings between 50-130 cm in height; Class 4: Saplings more than 130 cm height but less than 5 cm dbh; Class
5: individuals with dbh equal or greater than 5. Numeric variables are expressed as means ± standard deviation. Units of measure
are indicated in brackets. % Heterozygosity refers to single nucleotide polymorphism (SNP) loci. Herbivory index is a
dimensionless variable calculated after (Benitez-Malvido et al. 1999) as a proxy of herbivory pressure exerted by caterpillars upon
each tree (See Material and Methods for further explanations).
Site UTM_X
(long)
UTM_Y
(lat)
Stage
class
Age
(years)
% Heterozygosity
(% heterozygous loci/
total loci)
Min distance to
edge
(metres)
Connectivity to
mature oaks
(m2)
Herbivory
index
Cardedeu 413672.565 4583290.7 1 2.9 ± 1.6 0.21 ± 0.06 11.33 ± 4.99 0.0116 ± 0.0053 15.04 ± 15.81
Cardedeu 413669.974 4583291.7 2 4.9 ± 1.7 0.22 ± 0.05 12.78 ± 6.29 0.0116 ± 0.0056 14.17 ± 15.30
Cardedeu 413672.714 4583289.6 3 7.9 ± 2.9 0.20 ± 0.07 12.39 ± 5.77 0.0128 ± 0.0068 7.16 ± 4.72
Cardedeu 413690.867 4583314.7 4 13.4 ± 5.3 0.22 ± 0.07 16.00 ± 5.01 0.0133 ± 0.0044 5.71 ± 7.17
Cardedeu 413691.194 4583316.7 5 23.0 ± 5.9 0.25 ± 0.05 17.04 ± 5.38 0.0386 ± 0.0097 0.12 ± 0.33
Martorell 443704.362 4608785.4 1 2.4 ± 1.2 0.29 ± 0.11 21.54 ± 8.40 0.0040 ± 0.0004 10.09 ± 8.96
Martorell 443706.723 4608779.7 2 4.7 ± 1.5 0.26 ± 0.10 21.16 ± 9.84 0.0041 ± 0.0004 7.45 ± 6.38
Martorell 443706.547 4608784.4 3 10.7 ± 3.0 0.24 ± 0.08 22.42 ± 9.11 0.0059 ± 0.0003 3.23 ± 3.47
Martorell 443709.066 4608782.7 4 17.6 ± 4.3 0.23 ± 0.06 17.35 ± 8.30 0.0065 ± 0.0010 1.58 ± 1.57
Martorell 443687.021 4608848.8 5 19.8 ± 5.2 0.24 ± 0.08 4.43 ± 4.09 0.0060 ± 0.0004 0.05 ± 0.22
Cervelló 408533.297 4593310.0 1 3.1 ± 1.4 0.19 ± 0.07 12.92 ± 7.69 0.0148 ± 0.0105 11.21 ± 9.45
Cervelló 408548.992 4593317.1 2 4.7 ± 1.6 0.18 ± 0.07 9.85 ± 6.20 0.0136 ± 0.0114 5.93 ± 5.65
Cervelló 408556.803 4593291.2 3 8.5 ± 2.9 0.20 ± 0.05 10.73 ± 6.58 0.0146 ± 0.0114 4.5 ± 5.65
Cervelló 408468.245 4593264.8 4 15.5 ± 4.7 0.18 ± 0.06 13.73 ± 5.81 0.0178 ± 0.0043 0.80 ± 0.86
Cervelló 408468.465 4593272.3 5 24.0 ± 4.4 0.22 ± 0.03 16.16 ± 3.29 0.0185 ± 0.0062 0.00 ± 0.00

Chapter 3: The role of host genetics, ontogeny and location on herbivory
58
Table 2. Lositan table summary describing SNP candidate loci under selection at each sampling site. The summarized information includes type
of selection (neutral, balancing, positive), observed heterozygosity (i.e. number of individuals heterozygous for a particular locus), FST statistic
(fixation index based on genetic distances for short divergence time) and associated P value (for a 95% CI).
Site Locus Selection type Heterozygosity FST P (Simul Fst < sample Fst)
Cardedeu SNP 18 Balancing 0.483827 -0.010491 0.024998
SNP 39 Positive 0.30288 0.099183 0.983846
SNP 40 Balancing 0.500665 -0.010522 0.017272
SNP 49 Balancing 0.410178 -0.010058 0.01277
SNP 50 Balancing 0.247221 -0.009345 0.023255
SNP 51 Balancing 0.258051 -0.011068 0.011921
Martorell SNP 1 Balancing 0.267598 -0.01791 0.005353
SNP 12 Positive 0.166667 0.133333 0.979187
SNP 26 Balancing 0.500859 -0.014597 0.019767
SNP 40 Positive 0.514859 0.139803 0.985193
SNP 44 Balancing 0.1533 -0.013755 0.02303
SNP 45 Balancing 0.303872 -0.014195 0.009302
SNP 46 Balancing 0.10783 -0.020397 0.0
SNP 47 Balancing 0.457467 -0.019525 0.00501
SNP 53 Positive 0.487072 0.145515 0.992504
SNP 55 Balancing 0.441523 -0.016314 0.002453
Cervelló SNP 24 Balancing 0.25331 -0.007977 0.018051
SNP 34 Balancing 0.152435 -0.008808 0.022873

Chapter 3: The role of host genetics, ontogeny and location on herbivory
59

Chapter 4: Zero-sum landscape effects on acorn predation
59
Chapter 4: Zero-sum landscape effects on acorn predation associated to
shifts in granivore insect community in new holm oak (Quercus ilex)
forests
RUIZ-CARBAYO, H., BONAL, R., PINO, J., ESPELTA, J. M.
Published in Diversity and Distributions (2018), Vol 24(4), pp. 521-534
Abstract
Aim: Landscape attributes can determine plant-animal interactions via effects on the identity
and abundance of the involved species. Since most studies have been conducted in a context
of habitat loss and fragmentation, we know very little about interaction assembly in new
habitats from a landscape approach. This study aimed to test the effect of forest age and
connectivity on acorn predation by a guild of predator insects differing in dispersal ability and
resilience mechanisms: two weevils (Curculio elephas and C. glandium) and one moth (Cydia
fagiglandana) in expanding Quercus ilex forests.
Location: Barcelona, Spain.
Methods: We assessed the proportion of infested acorns and identified the predator at the
species level in five patches of connected old forests, connected new forests and isolated new
forests. Effects of habitat age and connectivity at three scales (tree, patch and landscape) were
analyzed using generalized linear mixed effects models.
Results: Predation by weevils was positively associated with old connected forests, while
moths, with better dispersal ability, were able to predate upon all patches equally. Moreover,
C. elephas, the weevil with lower dispersal ability, exhibited colonization credits in the new
isolated patches. In spite of these changes in the guild of seed predators, the proportion of
infested acorns was non-significantly different among forests.
Main conclusions: The guild of seed predators may vary depending on forest age and
connectivity. However, because those with higher dispersal ability may replace less mobile
species, this resulted in zero-sum effects of landscape attributes on acorn predation (i.e.
similar predation rates in well-connected old forests vs. isolated new forests).

Chapter 4: Zero-sum landscape effects on acorn predation
60
Keywords: acorn predation, biotic interactions, forest regeneration, landscape structure, life-
history traits, spatiotemporal effects, zero-sum effects
4.1 Introduction
Plant-animal interactions are among the most important processes shaping biodiversity
(Rinker and Lowman 2004; Maron and Crone 2006; Valiente-Banuet et al. 2015). Even though
interactions occur locally, they often depend on contrasting metacommunity processes
operating at several spatiotemporal scales and involving different life-history traits of the
organisms (Thies et al., 2003). While species sorting is often associated to niche differences
among habitat patches and inter-specific competitive ability , both mass effects and neutral
processes are frequently determined by the interaction of habitat spatial structure and animal
dispersal abilities (Shmida and Wilson 1985; Pulliam 1988). Moreover, habitat change in the
landscape frequently determines patch dynamics processes of species colonizations and
extinctions. It is known for long that dispersal is a primary driver for community assembly and
governs the reorganization of species interactions under environmental change (Thompson
and Gonzalez 2017). In this context, landscape structure and dynamics exerts a myriad of
effects on community processes from metapopulation to metacommunity dynamics , affecting
species interactions and ecosystem functioning (Tscharntke et al. 2012).
Alternative (e.g. neutral, niche or trade-off) models of community assembly emphasize the
importance of diverse mechanisms (e.g. demographic and niche differences among species,
dispersal-limitation, and stochastic processes (Hubbell, 2001; Leibold et al., 2004; Tilman,
2004; Ernest et al., 2008). Despite these differences, however, most of these models
incorporate in some extent three common processes: resource limitation, ecological niche
overlap among species, and exchanges of species and individuals between local community
and regional scales. Among these, resource limitation has recently concentrated much
attention because it is a basic assumption of neutral theory (Hubbell, 2001). If some resource
is limiting at the entire community level, a fixed limit on the total number of individuals can be
set. Thus, species might exhibit density compensation or trade-off, thus manifesting as zero-
sum dynamics or community-level carrying capacity (Ernest et al., 2008). Zero-sum effects
from biodiversity trade-offs can also been extended to ecosystem processes like ecosystem
metabolism (Ernest et al., 2009), despite these effects have been poorly investigated.
The role of landscape structure and dynamics on these zero-sum effects is also particularly
unexplored, despite it is largely known that landscape structure determine species filtering and

Chapter 4: Zero-sum landscape effects on acorn predation
61
trade-offs across space and time. Many studies have highlighted the importance of landscape
structure, and especially of habitat connectivity, for plant-animal interactions in the context of
habitat loss and fragmentation (e.g. deforestation). Conversely, only few authors have
explored the effects of habitat recovery on the assembly of plant-animal interactions (de la
Peña et al., 2016). Previous studies highlighted the importance of landscape structure and its
interaction with species attributes (e.g. dormancy and dispersal ability) in the assembly of
plant-insect interactions in new habitat patches (Bouget et al. 2015; Ruiz-Carbayo et al., 2017).
Recent formation and high isolation of habitat patches may result in time lags (namely,
colonisation credits) for some species, especially those with poor dispersal ability (Heiniger et
al. 2014; Bagaria et al. 2015). This may be especially relevant for interactions involving small
specialists, like insects (Thomas et al. 2001; Kruess 2003). Beyond the interest in identifying the
assemblage rules, the sign (positive or negative) of the interaction may ultimately influence
the dynamics of the habitats where they occur, either arresting or speeding their expansion
process.
Density-dependent effects, such as those considered in the Janzen-Connell hypothesis may
provide a theoretical basis on which to analyse recruitment in new forest patches, considering
the conspecific density of seeds, distance from parent trees (old forests) and foraging
efficiency of seed predators (Hammond and Brown 1998; Wright 2002; Terborgh 2012). For
example, it may take longer for herbivores or seed predators to find the target species in new
and isolated patches, decreasing foraging efficiency either because they cannot disperse
further (distance-response) or because the density is so low that searching is no longer
profitable (density-response) (Beckman et al., 2012). Similarly, the shorter the time a new
patch has been available, the lower the probability may be of plant enemies finding the host
(Ruiz-Carbayo et al., 2017). In these cases, the young age or isolation of a patch may diminish
insect damage and favour the expansion process of the new habitat, in a sort of “enemy
release” effect (De la Vega et al. 2012). Conversely, expansion may take longer if plants
established in new and isolated patches experience higher levels of herbivory, owing to the
lack of natural enemies of herbivorous insects (Roland 1993; Terborgh et al., 2001) . From a
metacommunity point of view (neutral-based models), habitat connectivity might help to
promote mass effects on predator populations, thus increasing colonization success and
damage on host plants across the landscape, while specific patch dynamics might help to
promote or to arrest these landscape processes (Leibold et al., 2004). Still, landscape attributes
may also have a zero-sum effect on the host-predator interactions if there is merely a
substitution of species among patches with a fixed total amount of resources. At a regional

Chapter 4: Zero-sum landscape effects on acorn predation
62
scale, more resilient species with poor dispersal abilities will gather in the older forests while
species with higher dispersal abilities will be able to reach the new and more isolated ones
(Hendrickx et al. 2009; Hernández et al. 2014; Evans et al. 2015). At the local scale, niche
characteristics will take over and also play an important role in the compensatory dynamics
that maintain the zero-sum.
In the literature the effects of these landscape attributes on seed predator insects have
attracted much less attention (but see Orrock et al. 2003 and Orrock and Damschen 2005) than
effects on herbivores, in spite of the negative effects of seed predation on plant fitness by
reducing the number of viable seeds (Siepielski and Benkman 2008; Espelta et al. 2009a). Since
seeds can be viewed as sedentary preys (Janzen 1971; Hulme 1998), a vanishing of the
“predator release” effect in new forest patches can be expected to occur as spatial
connectivity increases and facilitates the movement of seed predators (Koivula et al. 2002;
Fountain-Jones et al. 2015) or as the forest patch ages, thus allowing recurrent colonisation
events. In this study, we have analysed the effects of age and connectivity of forest patches in
the composition of the granivore guild of insects and the consequences (negative, positive,
neutral) for acorn predation in expanding holm oak (Quercus ilex L.) forests in NE Spain. As in
other regions in the world (Fuchs et al. 2013; Rudel et al. 2009) there is growing evidence of
forest recovery in the Mediterranean Basin in recent decades, following economic
development (Lambin and Geist 2006; Vilà-Cabrera et al. 2016). These new Mediterranean
forests offer an ideal study system to assess these questions as Q. ilex can be considered a
foundation species with large implications in ecosystem functioning (sensu Angelini et al. 2011)
and its acorns are heavily depredated by a guild of predators. These include weevils (Curculio
glandium Marsham and C. elephas Gyllenhal (Curculionidae)) and moths (Cydia fagiglandana
Zeller (Tortricidae)) (Jiménez-Pino 2011; Espelta et al. 2009b), which differ in their dispersal
ability (higher in C. fagiglandana, intermediate in C. glandium and lower in C. elephas) and
resilience to unsuitable conditions (Schumacher et al. 1997; Soria 1999; Jiménez-Pino 2011;
Pélisson et al. 2013). Moreover, besides potential differences in predation intensity, the
identity of the guild predators can further affect recruitment as the amount of cotyledon
consumed and embryo predation likelihood might differ among the abovementioned acorn
predators, and this affects the survival of infested acorns (Siscart et al. 1999 ; Bonal et al.
2007). Specifically, we assessed whether: i) the composition of the guild of insect predators
changed with the age and connectivity of forest patches; ii) the proportion of acorns predated
differed according to dispersal abilities of predator species; iii) the overall acorn predation
Chapter 4: Zero-sum landscape effects on acorn predation
63
rates differed in new and more isolated patches; and iv) the composition of the insect guild
prompted differences in embryo survival between oak patches. We hypothesise that,
considering the abovementioned differences in terms of resilience and dispersal ability, Cydia
will better colonise forests regardless of their age and spatial connectivity. On the contrary,
Curculio will show a distance-decay pattern from old to new and isolated forests with further
differences between the two weevil species (i.e. higher ability of C. glandium over C. elephas
to colonise new distant sites). The lower presence of weevils in new forests would then result
in lower acorn predation in these sites, and a higher presence of partially predated acorns
(those attacked by Cydia) with higher germination potential.
4.2 Methods
4.2.1 Study area and study species
We conducted the study in the Vallès lowland (Barcelona, Spain, 41° 33′N, 2° 2′E) (see Fig.1)
from August to October 2014. Climate in this region is Mediterranean, with annual average
rainfall about 650 mm and mean temperatures ranging from 6°C in winter up to 23°C in
summer. As in many parts of the Iberian Peninsula (Vilà-Cabrera et al., 2017), forest has
noticeably increased in the Barcelona region in recent decades (Baśnou et al., 2013), thus
determining a landscape mosaic of forest patches, both pre-existing and recent, mostly made
up by mixed stands of Pinus pinea, P. halepensis, Quercus ilex and Q. humilis. Pine and oak
cover in these forest stands mostly follow a well-known successional change associated to
recent patch dynamics, with Quercus species being mostly concentrated in pre-existing forests
and Pinus species in recent ones (Guirado et al. 2008). In any case, Holm oak (Q. ilex) has
successfully colonised abandoned agriculture and pasture areas since the 1950s (Guirado et al.
2008; Puerta-Piñero et al., 2012; Basnou et al. 2016) in many parts of the Iberian Peninsula.
The two major climatic factors limiting Q. ilex distribution are winter cold and summer drought
(Terradas & Savé, 1992; Terradas, 1999), both related to hydric stress. Shortage in water
availability has been seen to affect parameters related to reproduction (Sánchez-Humanes &
Espelta, 2011; Espelta et al., 2008). Therefore, difficulties in the sexual regeneration of
Mediterranean oak coppices have been extensively documented (Espelta et al., 1995; Gracia et
al., 2001) and have been considered a potential constraint for their long-term persistence
(Retana et al., 1999). However, the oak forests in the Vallès lowland are embedded in strongly
transformed landscapes with large human populations and industrial areas (Terradas, 1999).
Thus, the main constraint for the regeneration of Q. ilex in this county has been land-use

Chapter 4: Zero-sum landscape effects on acorn predation
64
changes associated to human activity (Basnou et al., 2016). Light-tolerant Pinus spp. pioneered
colonization, followed by more shade-tolerant Quercus spp., whose upper-limit age has been
estimated to be 35 years (H. Ruiz-Carbayo, unpublished results). Since the onset of
reproduction in Q. ilex takes around 15-20 years (Sánchez-Humanes & Espelta, 2011),
establishment and demographic dynamics of this woody species in these emerging forest
patches can still be attributed to the activity of important seed dispersers (e.g. jays Garrulus
glandarius L. and wood mice Apodemus sylvaticus L.; see (Bossema, 1979; Jensen & Nielsen,
1986). In fact, our own preliminary studies based on molecular techniques has shown that
most oak seedlings and saplings in these new forest patches come from foreign seed arrival
(unpublished results). The most important seed predators in Iberian Q. ilex forests are acorn
moths of the family Tortricidae (e.g. C. fagiglandana) and weevils of the genus Curculio spp.
(Coleoptera: Curculionidae), C. elephas and C. glandium being the most prevalent species
foraging in these NE Spain forests (Espelta, Bonal and Sánchez-Humanes 2009). Adult weevils
emerge from their underground overwintering earth cells in spring (C. glandium) or late
summer (C. elephas) and climb to the oak canopies. Mating takes place in late summer-
autumn, when acorns are already grown and available for oviposition. Shortly after mating,
females oviposit into the developing acorns, which causes premature acorn abscission (Bonal
& Muñoz, 2008). Larval development within the acorn lasts approximately 30 days (depending
on the temperature) and when it is finished they leave the acorn to bury for diapause (Bonal
and Muñoz 2009). C. fagiglandana (Lepidoptera: Tortricidae) has a univoltine cycle with five
larval stages. Adults fly from June to September depending on the location, and egg-laying
occurs from late June to late October (Jiménez et al., 2006). Eggs are individually laid inside
new shoot leaves close to the acorns. Larval development lasts about 30-40 days and larvae
can shift from one acorn to another, a trait that has been interpreted as a way to escape
resource limitation (Soria, 1999). The mature larva exits the acorn to spend the diapause
period underground, protected by a cocoon. In spring, they emerge to the surface and pupate.
Curculio and Cydia species differ markedly in terms of life-history traits of extinction-risk
spreading such as dispersal ability and dormancy. Curculio species have moderate flight
abilities and great diapause variability (with adults of the same cohort emerging over several
years) (Pélisson et al., 2013), while Cydia exhibits good dispersal abilities but does not have any
dormancy strategy (Schumacher et al., 1997). Within the Curculio genus inhabiting oak forests,
there are also differences in dispersal abilities, the small-bodied C. glandium being a better
disperser than the large C. elephas (1200 m vs. 600 m, respectively) (Pélisson et al., 2013).
Moreover they also differ in the way they predate upon acorns: i.e. weevil larvae develop

Chapter 4: Zero-sum landscape effects on acorn predation
65
inside a single acorn, commonly exhausting the cotyledons prior to completing their
development, while a single moth larva can predate upon several acorns, not always
exhausting the cotyledon tissues (Soria, 1999).
4.2.2 Experimental design and sampling
Based on the comparison of 1956- and 2009- land cover maps and orthoimages available for all
Barcelona province and complementary field visits, we established a dichotomy on forest
patch age (old vs. new). Forest patches present in both 2009 and 1956 maps were considered
“old patches“, while those absent in 1956 (i.e. being croplands or scrublands) but present in
2009 were considered recent. We established five sampling sites in which habitat connectivity
was studied at three scales: landscape, patch and tree. Landscape connectivity at each
replicate site was estimated by setting 1-km radius buffers around each holm oak crown and
merging all buffers to create a landscape buffer, in which we calculated forest cover
percentage. Regarding connectivity at the patch level, since forests in the study area are
arranged in patches rarely isolated from each other by more than 600 m, we set this distance
as the threshold of the connected vs. isolated forest dichotomy and applied 600-m radius
buffers of 20% of forest cover on the orthoimages. Then, within each site, we selected one old
forest patch to act as control treatment, and two post-agricultural new forest patches,
connected and isolated; hereafter called old forest (OF), connected new forest (CNF) and
isolated new forest (INF). Finally, we estimated tree connectivity, setting 600-m radius buffers
around each holm oak crown and calculating the total squared metres within that area
covered by forest. In addition, previous literature has shown differences in pre-dispersal
predation by Curculio species to be associated with differences in seed abundance (plant
satiation) or the ability of seeds to survive infestation depending on their size (Espelta et al.
2009a). For this reason, we estimated tree acorn production and measured acorn volume to
account for the possible interaction of these variables with the effects of age and connectivity.
Sampling started in late August 2014, when we randomly selected five seed-producing trees
(i.e. 75 in total) within each forest patch and carried out a survey of seed crops at tree level
(see Table 1 for summary information). We adapted the classical visual count method by
Koenig et al. (1994) so two observers would simultaneously count the maximum number of
acorns on the oak crown for one minute and would record the resulting average of both
counts as the estimated yearly acorn production of the tree. In order to sample the whole time
window available for oviposition by both C. fagiglandana and Curculio spp., we carried out
three sampling events during the acorn season: beginning (mid-late September), peak
Chapter 4: Zero-sum landscape effects on acorn predation
66
(beginning of October) and end (late October), as the two groups show slightly different
phenologies (earlier infestation in Cydia). In each oak, we gathered a random sample of 30
acorns (i.e. a total of 90 acorns) from several branches on its crown. We immediately
transferred samples to the laboratory where we measured the length and width of all acorns.
We separated them into sound and infested according to the presence of Curculio oviposition
scars or external signs of Cydia infestation. We marked infested acorns following a unique
numbering system, placed them in individual plastic vials opened above, and checked every
two days for emerged larvae (Bonal and Muñoz 2009). We distinguished moth and weevil
larvae with the naked eye but, since weevil larvae cannot be assigned to the species level by
external morphological signs, we preserved them in 99% ethanol and stored them at low
temperature (4ºC) for further genetic analysis. We recorded larval exit for ca. two months and,
two weeks after the larvae stopped emerging, we opened all acorns in order to collect any
remaining larvae inside and to record whether the embryo had been predated or not.
4.2.3 Genetic analysis
Curculio spp. and C. fagiglandana larvae can be easily distinguished according to morphology.
However, there are no reliable morphological differences between C. glandium and C. elephas
larvae to tell them apart. For this reason we made the identification by mitochondrial DNA
sequencing and comparison with reference sequences from previously identified individuals
(see Bonal et al. 2011). We randomly selected a total of 450 Curculio spp. individuals (30 from
each forest stand population) to be analysed using species-specific mitochondrial primers. We
carried out the extraction of total DNA from the posterior third of the larva’s body using
NucleoSpin® Tissue (MACHEREY-NAGEL GmbH and Co. KG, Düren, Germany) according to the
manufacturer’s instructions. We sequenced a fragment (826 bp) of the mitochondrial
cytochrome oxidase subunit 1 (cox1) using the Pat and Jerry primers following methods
described previously (Hughes & Vogler, 2004). We performed PCR amplification in a volume of
14 µL, consisting of 1.5 µL of template DNA sample, 11.2 µL of double-distilled water, 1.5 µL of
PCR buffer, 0.6 µL of MgCl2, 0.25 µL of deoxyribonucleotide triphosphate (100 mmol/L), 0.2 of
each primer (10 µmol/L) (forward [F] and reverse [R]), and 0.06 µL of Taq polymerase (Linus).
PCR cycles used the following conditions: a 9 min denaturation at 95ºC, 40 cycles of 30 s
denaturation at 94ºC, a 45 s annealing at 50ºC, and 45 s min elongation at 72ºC, with a final
extension step of 10 min at 72ºC. 4µL PCR product separated by electrophoresis on 3% (w/v)
agarose gels with 1× Tris–borate–EDTA buffer at a voltage of 60 V during 25 min and 70 V for
15 min. The gel contained 0.005% Midori Green nucleic acid staining solution. We checked the
stained gel under ultraviolet light looking for the presence of DNA bands. Sequencing allowed
Chapter 4: Zero-sum landscape effects on acorn predation
67
the identification of larvae identity and was performed using Big-Dye (Perkin-Elmer)
technology and an ABI3700 sequencer. We edited forward and reverse strands using
Sequencher 4.1 (Gene Codes, Ann Arbor, MI, USA). We edited sequences using SEQUENCHER
4.1 (Gene Codes Corp., Ann Arbor, MI, USA) and pooled and aligned with CLUSTALW supplied
via http://align.genome.jp (gap open and gap extension penalties were those provided by
default by the software, 15 and 6.66 respectively) including a set of reference sequences of
Holarctic Curculio (Hughes & Vogler, 2004). According to their similarity to these references,
we could assign all sequences to either C. elephas or C. glandium. The raw genetic divergence
(ratio between the total number of differences and the total sequence length) of the
sequences with respect to the reference with which each one was matched was always below
2%, much higher than the inter-specific divergence between C. elephas and C. glandium, which
are distantly related (Bonal et al., 2011).
4.2.4 Statistical analysis
Prior to modelling we looked for collinearity among continuous predictors (landscape
connectivity, tree connectivity, tree acorn production and acorn volume) using Pearson’s
correlation coefficients. The highest r2 value was found for tree connectivity and tree acorn
production (r2 = 0.45), and so we did not drop any explicative variable from the analysis.
We analysed the effect of forest type (OF, CNF, INF), landscape connectivity and tree
connectivity on acorn predation (overall infestation regardless of parasite identity, infestation
by C. fagiglandana, infestation by Curculio spp, multi-infestation by several Curculio spp larvae,
multi-infestation by both C. fagiglandana and Curculio spp, infestation by C. elephas and
infestation by C. glandium) by means of generalised linear mixed-effects models (GLMM) for a
variable with a binomial distribution (infested acorn vs. non-infested acorn) and a logit link
function (see Table 2). In all models, we included forest type, landscape connectivity and tree
connectivity as fixed factors (as well as tree acorn production and acorn volume to control for
their effects); we used a nested error structure for the model (site: tree) to account for the
inherent variability of the landscape. We also tested the effects of insect identity (Curculio,
Cydia or both), forest type (OF, CNF, and INF), landscape connectivity and tree connectivity on
the probability of survival of the acorn embryo by means of GLMMs. We built saturated
models with all fixed effects plus their second-degree interactions; selection of the best
models was made based on second-order Akaike Information Criterion (AICc) and adjusted R2.
We carried out the validation of the models by plotting observed data vs. residuals of the
Chapter 4: Zero-sum landscape effects on acorn predation
68
model and by performing overdispersion tests. We conducted all statistical analysis using R,
version 3.0.3 (R Core Team 2017).
4.3 Results
The overall acorn predation percentage was 21%; Curculio spp were present in 58% of the
infested acorns while C. fagiglandana had a lower occurrence, being present in 48%. Acorn
predation was not significantly different among forest types (OF: old forest, CNF: connected
new forest and INF: isolated new forest) when no distinction was made between predators
(Figure 2.1) and the only significant effect observed was a higher predation in larger acorns
and more connected trees (z-value = 6.19; P-value < 0.001; Table 2). When looking at
predation by moths and weevils separately, differences in granivory frequencies between
forest types arose. Infestation probability by Cydia was not affected by forest type (“forest
type” predictor dropped from best model according to AICc; Figure 2.2). On the contrary, as
shown in Figure 2.3, the probability of infestation by Curculio differed significantly between
forest types, being higher in old forest than in either connected or isolated new ones (z-value =
0.56; P-value < 0.05 and z-value = 1.13; P-value < 0.001, respectively), in accordance with the
differences in dispersal ability of moths (higher) and weevils (lower). At a tree level, models
also revealed the existence of a positive acorn size effect on predation in trees with smaller
acorn crops for Cydia and on more connected trees by Curculio (respectively, z-value = -3.390;
P-value < 0.001 and z-value = 3.152; P-value = 0.002). Fixed factors in statistical models
accounted for 11% of variance in Cydia and 17% in Curculio (Table 2). Multi-infestation of
acorns either by Curculio and Cydia, or by the two Curculio species exclusively, showed very
low occurrences (6.2% and 11.1% of infested acorns respectively) and was similar in the three
forest types.
Almost two-thirds (64%) of the 450 Curculio spp. individuals identified (by the cytochrome
oxidase I gene) belonged to C. elephas; the remaining third corresponded to C. glandium.
When looking at acorn predation by either C. elephas or C. glandium, we observed differences
between their infestation probabilities in all three spatial scales considered (landscape, forest
and tree). Probability of infestation by C. elephas vs. C. glandium was significantly higher in
more connected landscapes (z-value = 2.54; P-value = 0.01), in old forests than in isolated new
ones (z-value = 2.11; P-value = 0.04; see also Figure 2.4) and in less connected trees (z-value = -
3.10; P-value = 0.002).
Chapter 4: Zero-sum landscape effects on acorn predation
69
Nearly 85% of the bitten acorns experienced depletion of the embryo. Acorn size showed
strong, positive effects on the probability of acorn embryo survival (z-value = 11.11; P-value <
0.001). Acorns infested by Cydia experienced a significantly higher probability of the embryo
being kept alive than acorns infested by Curculio (z-value = 3.75; P-value < 0.001; see also
Figure 3), while no significant effects were found when comparing sibling weevil species (P-
value > 0.05). However, embryo survival probability was not significantly different among
forest types (P > 0.05).
4.4 Discussion
Our study shows that the community of acorn-predator insects in Q. ilex forests changes across
space and time according to habitat attributes (age and connectivity), and that the effects of
these attributes can be observed at tree, patch and landscape scales. Colonisation credit has
been found in Curculio species in consonance with their limited dispersal ability, while Cydia
populations do not show any significant association with habitat connectivity at any scale. The
study also shows that these changes in predator community determines, however, zero-sum
effects on acorn predation intensity, which is only modulated by habitat connectivity at local
(tree) scale. In consequence, no predator release effects have been observed.
While some studies have previously reported the effects of connectivity on the assembly
process of insect communities, our results highlight the importance that habitat patch age (i.e.
the time that a habitat patch has been available for colonisation) may have in this process, as it
determines the colonisation credit of poor-disperser acorn predators like Curculio species.
Similar results have been found in Lepidoptera communities in Holm-oak savannas subjected
to very low habitat connectivity (Ruiz-Carbayo et al., 2017). On the other hand, neutral effects
of habitat connectivity on seed predation, owing to the compensation of some absent species
by an increase in others with higher dispersal ability, have also been previously reported
(Hendrickx et al. 2009; Brudvig et al. 2015). Indeed, the way in which habitat connectivity
modify herbivory or seed predation seems to be highly dependent on how similar or different
predator species are in key life-history traits (Beckman et al., 2012). In some cases, there is a
shift in the abundances of the different members of the guild; in other cases, some groups
maintain their predation levels while others increase it. For example, Orrock et al. (2003)
reported the lack of significant effects of patch connectivity on pre-dispersal seed predation
due to a shift in the relative importance of predator species: i.e. invertebrates removed more
seeds in unconnected patches where rodents removed fewer seeds, and vice versa in more

Chapter 4: Zero-sum landscape effects on acorn predation
70
connected patches. In our study system, the potential “release” effect of the colonisation
credits exhibited by Curculio in new forest patches is counterbalanced by the even distribution
of the good disperser Cydia. In addition, the identity of the predators and the way they
predate upon the seeds revealed a negative effect by weevils on the probability of embryo
survival compared to moths. Nevertheless, the potential advantage of embryo survival in
acorns in new isolated forests, due to lower probability of infestation by C. elephas, did not
attain significant values.
The fact that moths showed a similar probability of infestation in all forest types is in line with
their good dispersal ability (maximum dispersal distance of 11 km in Schumacher et al. 1997).
So, in our study area this moth finds no barriers to colonisation, no matter how long the forest
patch has been available for colonisation (old or new) or its spatial connectivity, as linear
distances between forest patches were always under 11 km. In contrast, Curculio species were
significantly more present in old forests than in new ones in consonance with the poorer
dispersal abilities of this group, being less efficient at selecting its habitat by active flight and
having a risk-spreading strategy based more on the resilience offered by its variable diapause
(Pélisson et al. 2012; Govindan and Swihart 2015). This strategy allows emerging local
populations at new oak patches to avoid extinction even after eventual catastrophic events
(e.g. null acorn production in a certain year) as the emergence of the offspring of each female
is spread over three to four years depending on the species (Soula and Menu 2003; Pélisson et
al. 2012). Interestingly, within this genus the higher infestation probabilities in old forests
compared to both new connected and new isolated ones, were due exclusively to the
decreasing trend shown by C. elephas from old to new isolated patches. By contrast, C.
glandium, which emerges in spring (Venner et al., 2011) and has a greater dispersal capacity,
showed an evenly distributed infestation probability among forest types, just as Cydia did. This
matches previous literature on dispersal ability within Curculio spp. showing that C. glandium
is able to disperse double the maximum distance estimated for C. elephas (1200 m vs. 600 m
respectively) (Pélisson et al., 2013). In our study area, almost all forest patches had forested
areas in a radius of 600 m, so the patches we considered isolated in the experimental design
may not have been much for C. glandium, which could be colonising them just as easily as
Cydia, in spite of the greater dispersal capacity of the moth.
The study also reveals that effects of habitat age and connectivity might operate at diverse
scales including tree, patch, and landscape. This last factor is only positively associated to
acorn infestation by the least dispersive species, Curculio elephas. This suggests that
metapopulation processes (Leibold et al. 2004) associated to landscape pattern might play a

Chapter 4: Zero-sum landscape effects on acorn predation
71
key role in the colonization of Q. ilex forests by this species. In addition, the decreasing trend in
the infestation probability of C. elephas, from old to new isolated forests, points out that not
only spatial connectivity but also habitat age may play a key role in determining the
assemblage of plant-animal interactions. Indeed, previous studies have highlighted the
importance of habitat age in insect community colonisation in new expanding habitats (see
Ruiz-Carbayo et al., 2017) because species need a certain amount of time to fully colonise the
new patch (Heiniger et al. 2014). In this context of old well-connected forests and new
expanding forests with different degrees of connectivity, old forests may be acting as a source
habitat of weevil dispersion towards younger forests patches, in a scaled colonisation process
that has not yet fully occurred in the new isolated ones. It takes around 15-20 years for Q. ilex
to reach the onset of reproduction (Sánchez-Humanes & Espelta, 2011), depending on
environmental conditions. Therefore, a plausible explanation for the immigration lag shown by
C. elephas in new isolated forests may be that oaks growing in this kind of patches may not
have been in place, at least in their mature reproductive stage, long enough for C. elephas to
fully colonise them up to old-forest levels. Moreover, the added effect of isolation of these
oaks would make the C. elephas colonisation pace even slower, revealing significant
differences between old and new isolated forests, which do not appear between the old and
the new connected ones. In addition, while C. glandium adults start emerging in June so they
have several months to look for acorns for egg-laying throughout the forest mosaic, this is not
the case of C. elephas, whose adult emergence strongly depends on late summer rains, just
before oviposition (Bonal et al., 2010). Since the emergence from the soil of C. elephas adults
occurs at the end of the acorn season in comparison to C. glandium, and it exhibits a reduced
dispersal ability, they maximize their fitness by climbing to the same tree under which they
have pupate, avoiding the risk of death inherent to searching for a distant tree. As a result, the
movement of C. elephas between trees is infrequent, especially if trees are scattered
(Debouzie et al., 1996) and the probability of a female reaching distant trees would be very
remote. Furthermore, the stochastic nature of summer storms may cause periodic bottlenecks
or even local population extinctions of C. elephas (Frouz & Kindlmann, 2015).
The likelihood of embryo survival differed among acorns attacked by different insect species:
i.e. acorns infested by Curculio experienced a higher probability of embryo predation than
acorns infested by Cydia. This stresses the likelihood that, not only the number of acorns
infested, but also the identity of the predator and the way it consumes the acorn, would be
vital factors to take into account when estimating the crop size available for plant recruitment.
This positive effect of Cydia on embryo survival could be related to the differential ethology (of

Chapter 4: Zero-sum landscape effects on acorn predation
72
both adults and larvae) of the species within the predator guild. Cydia caterpillars start feeding
on the cotyledons from the base of the acorn far away from the embryo, increasing the their
chances to fully develop ad libitum before killing the embryo, also, caterpillars may leave the
acorn and get into a new one if there is a pre-existing hole or crack in the seed coat. This is not
the case of Curculio, whose larvae are constrained to develop within a single acorn (Bonal &
Muñoz, 2008) and whose larger size ad libitum compared to Cydia caterpillars could make
them more ravenous, increasing the probability of embryo depletion. Therefore, the
immigration credit shown by C. elephas in new isolated forests, could benefit regeneration
potential with respect to old forests, since a higher number of acorns could maintain their
potential to develop into seedlings (Mack, 1998). However, the full colonisation of new
isolated forests by the other weevil species, C. glandium, prevented the appearance of that
advantage in isolated new forest patches.
Land-use changes limited to the socioeconomic development of many countries in the last few
decades, have led to high rates of habitat loss and fragmentation, but forest expansion has
also occurred in some areas due to land abandonment (Meyfroidt & Lambin, 2011). The speed
of forest regeneration and species composition will depend, among other factors, on the
outcome of biotic interactions. Recent studies analysing plant community assembly in new
established Mediterranean forests, including our study area, have shown that immigration
credit is quickly exhausted, except in the case of some particular species, such as oaks (Basnou
et al., 2016). In addition, the demographic and genetic analyses of new established patches
during the process of oak expansion, reveals that, even after the growth of adult and
reproductive trees occurs, most established oak seedlings continue to come from the
surrounding areas (more than 80% in Q. ilex patches (according to R. Bonal’s pers. obs.). This
arrested establishment of local oak seedlings may be the consequence of different processes
but we cannot rule out the possibility that acorn predation by weevils and moth may be
responsible for reducing seed crop size. Indeed, we have shown that not only the number of
predators that make it to the patch and infest the acorns, but also the identity of these
predators, affect the size of the seed viable pool. Nonetheless, we have shown that isolation of
new established forest patches does not prevent the arrival of the more mobile predators and
that, even though the guild of predators is different from the one in older forests, it does not
translate into a release of the pressure exerted on the size of the acorn crop.

Chapter 4: Zero-sum landscape effects on acorn predation
73
Acknowledgments
We are grateful to Dr Víctor Granda and Dr Marcos Fernández for their valuable help in the
statistical analysis as well as to Enrique Álvarez and Harold Arias for field assistance. This study
was funded by the MONTES (CONSOLIDER PII1C09-0256-9052), NOVFORESTS (CGL-2012-
33398) and PLAGANADO (AGL2014-54739-R) projects of the Spanish Ministry of Economy and
Competitiveness, and the project PII1C09-0256-9052 financed by the Regional Goverrment of
Castilla-La Mancha and the European Social Fund. Furthermore, HR was funded by a pre-
doctoral grant (BES-2013-065741) within NOVFORESTS, and RB was funded by a contract from
the Atracción de Talento Investigador Programme (Regional Government of Extremadura.

Chapter 4: Zero-sum landscape effects on acorn predation
74
Figure 1. Location of the study site. Top left: context and study site. Bottom left: sample
locations. Right: one of the replicates as an example of the experimental design

Chapter 4: Zero-sum landscape effects on acorn predation
75
Figure 2. Partial residual plots for the models of (a) overall, (b) Cydia, (c) Curculio, and (d)
Curculio elephas infestation probabilities without interactions. Letters within each panel
represent significant differences among forest types (OF: old forests, CNF: connected new
forests, INF: isolated new forests) without interactions. Light grey shading indicates 95%
confidence bands.
Figure 3. Partial residual plot for the embryo survival probability model without interactions.
Letters within the panel represent significant differences among acorn predator. Light grey
shading indicates 95% confidence bands.

Chapter 4: Zero-sum landscape effects on acorn predation
76
Table 1. List of study sites with their summary information according to tree ID, forest type
(OF: old forest, CNF: connected new forest, INF: isolated new forest), latitude and longitude
coordinates (given in decimal degrees), landscape connectivity (% forest cover), tree
connectivity (m2 forest cover), tree acorn production (number of acorns) and mean acorn size
(cm3).
Site
Tree
ID
Forest
Latitude
north
Longitude
west
Landscape
connectivity
(% forest cover)
Tree
connectivity
(m2)
Acorn
production
(number of
acorns)
Mean acorn size
± SE
(cm3)
1 18 OF 41.630538 2.326706 37.2 587.0 229 0.11 ± 0.01
1 19 OF 41.630533 2.326769 37.2 631.6 340 0.44 ± 0.04
1 20 OF 41.630463 2.327110 37.2 865.1 330 0.79 ± 0.05
1 21 OF 41.630454 2.327153 37.2 902.8 264 0.32 ± 0.02
1 22 OF 41.630366 2.327333 37.2 1038.8 298 0.61 ± 0.04
1 108 CNF 41.626487 2.340318 37.2 1519.9 239 0.70 ± 0.04
1 109 CNF 41.625455 2.338392 37.2 785.0 217 0.84 ± 0.06
1 110 CNF 41.625445 2.338203 37.2 709.2 286 1.04 ± 0.05
1 111 CNF 41.625513 2.338085 37.2 598.8 177 1.17 ± 0.06
1 112 CNF 41.625767 2.338139 37.2 452.2 241 0.40 ± 0.03
1 1 INF 41.567878 2.285703 37.2 848.2 178 1.56 ± 0.06
1 28 INF 41.629461 2.323903 37.2 444.0 196 0.05 ± 0.01
1 29 INF 41.629503 2.323884 37.2 391.1 137 0.07 ± 0.01
1 30 INF 41.629533 2.323858 37.2 370.1 141 0.13 ± 0.02
1 31 INF 41.629590 2.323773 37.2 302.0 85 0.19 ± 0.02
2 7 OF 41.565440 2.284260 13.3 1205.9 147 0.69 ± 0.04
2 8 OF 41.565372 2.284274 13.3 1150.0 114 1.01 ± 0.06
2 9 OF 41.565194 2.284033 13.3 1287.3 312 0.72 ± 0.07
2 10 OF 41.565155 2.283989 13.3 1310.1 231 0.85 ± 0.08
2 11 OF 41.565070 2.283978 13.3 1223.1 252 0.77 ± 0.07
2 2 CNF 41.567870 2.285681 13.3 878.9 273 0.80 ± 0.06
2 3 CNF 41.567391 2.285135 13.3 1328.3 279 1.17 ± 0.08
2 4 CNF 41.566376 2.284032 13.3 1712.4 206 0.37 ± 0.04
2 5 CNF 41.566255 2.283811 13.3 1692.0 87 0.57 ± 0.05
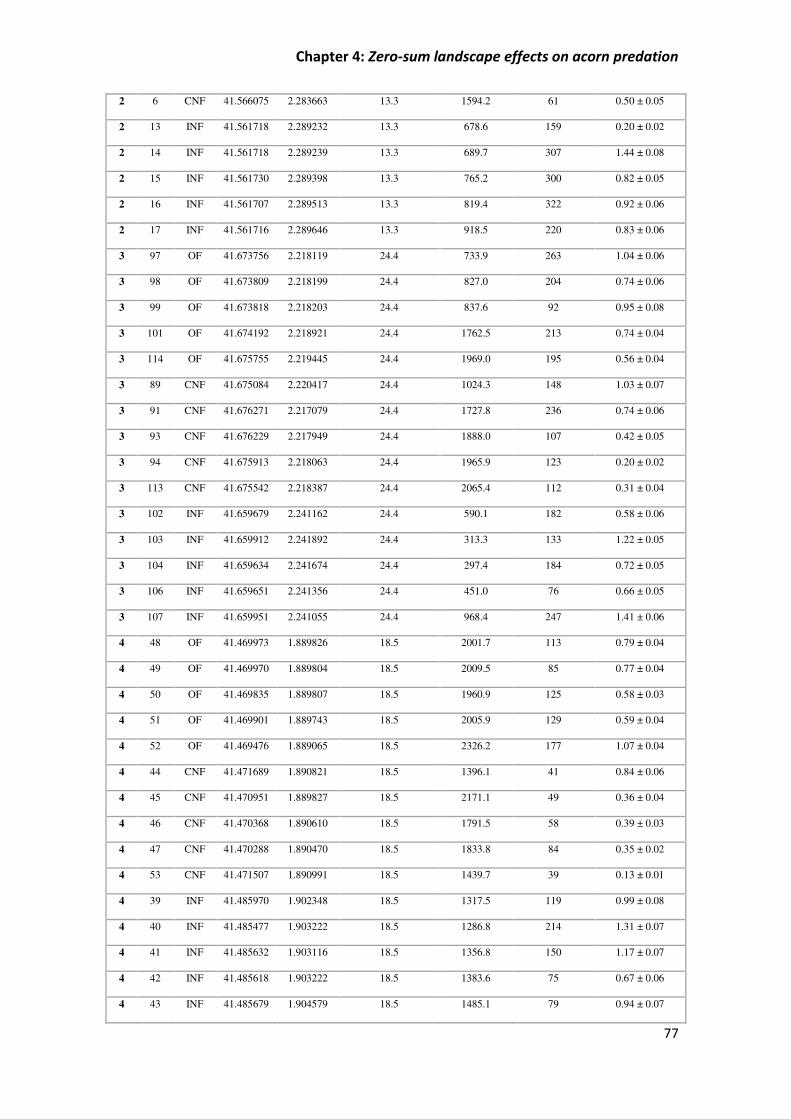
Chapter 4: Zero-sum landscape effects on acorn predation
77
2 6 CNF 41.566075 2.283663 13.3 1594.2 61 0.50 ± 0.05
2 13 INF 41.561718 2.289232 13.3 678.6 159 0.20 ± 0.02
2 14 INF 41.561718 2.289239 13.3 689.7 307 1.44 ± 0.08
2 15 INF 41.561730 2.289398 13.3 765.2 300 0.82 ± 0.05
2 16 INF 41.561707 2.289513 13.3 819.4 322 0.92 ± 0.06
2 17 INF 41.561716 2.289646 13.3 918.5 220 0.83 ± 0.06
3 97 OF 41.673756 2.218119 24.4 733.9 263 1.04 ± 0.06
3 98 OF 41.673809 2.218199 24.4 827.0 204 0.74 ± 0.06
3 99 OF 41.673818 2.218203 24.4 837.6 92 0.95 ± 0.08
3 101 OF 41.674192 2.218921 24.4 1762.5 213 0.74 ± 0.04
3 114 OF 41.675755 2.219445 24.4 1969.0 195 0.56 ± 0.04
3 89 CNF 41.675084 2.220417 24.4 1024.3 148 1.03 ± 0.07
3 91 CNF 41.676271 2.217079 24.4 1727.8 236 0.74 ± 0.06
3 93 CNF 41.676229 2.217949 24.4 1888.0 107 0.42 ± 0.05
3 94 CNF 41.675913 2.218063 24.4 1965.9 123 0.20 ± 0.02
3 113 CNF 41.675542 2.218387 24.4 2065.4 112 0.31 ± 0.04
3 102 INF 41.659679 2.241162 24.4 590.1 182 0.58 ± 0.06
3 103 INF 41.659912 2.241892 24.4 313.3 133 1.22 ± 0.05
3 104 INF 41.659634 2.241674 24.4 297.4 184 0.72 ± 0.05
3 106 INF 41.659651 2.241356 24.4 451.0 76 0.66 ± 0.05
3 107 INF 41.659951 2.241055 24.4 968.4 247 1.41 ± 0.06
4 48 OF 41.469973 1.889826 18.5 2001.7 113 0.79 ± 0.04
4 49 OF 41.469970 1.889804 18.5 2009.5 85 0.77 ± 0.04
4 50 OF 41.469835 1.889807 18.5 1960.9 125 0.58 ± 0.03
4 51 OF 41.469901 1.889743 18.5 2005.9 129 0.59 ± 0.04
4 52 OF 41.469476 1.889065 18.5 2326.2 177 1.07 ± 0.04
4 44 CNF 41.471689 1.890821 18.5 1396.1 41 0.84 ± 0.06
4 45 CNF 41.470951 1.889827 18.5 2171.1 49 0.36 ± 0.04
4 46 CNF 41.470368 1.890610 18.5 1791.5 58 0.39 ± 0.03
4 47 CNF 41.470288 1.890470 18.5 1833.8 84 0.35 ± 0.02
4 53 CNF 41.471507 1.890991 18.5 1439.7 39 0.13 ± 0.01
4 39 INF 41.485970 1.902348 18.5 1317.5 119 0.99 ± 0.08
4 40 INF 41.485477 1.903222 18.5 1286.8 214 1.31 ± 0.07
4 41 INF 41.485632 1.903116 18.5 1356.8 150 1.17 ± 0.07
4 42 INF 41.485618 1.903222 18.5 1383.6 75 0.67 ± 0.06
4 43 INF 41.485679 1.904579 18.5 1485.1 79 0.94 ± 0.07
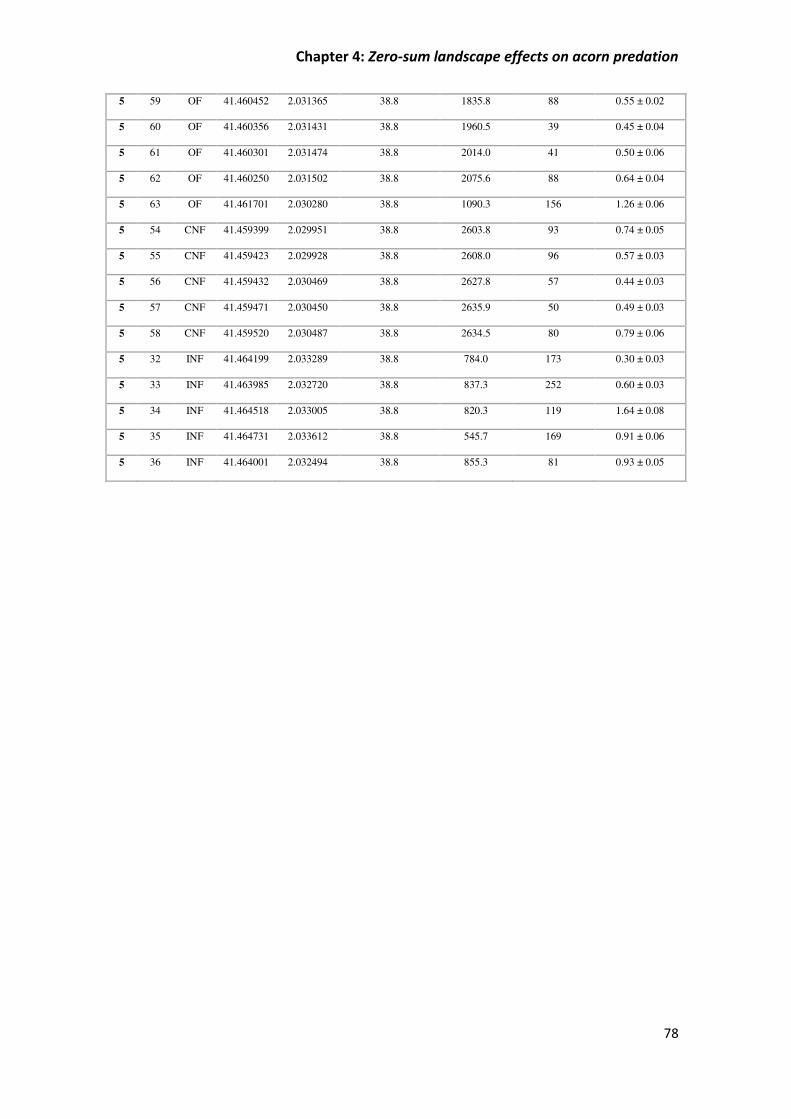
Chapter 4: Zero-sum landscape effects on acorn predation
78
5 59 OF 41.460452 2.031365 38.8 1835.8 88 0.55 ± 0.02
5 60 OF 41.460356 2.031431 38.8 1960.5 39 0.45 ± 0.04
5 61 OF 41.460301 2.031474 38.8 2014.0 41 0.50 ± 0.06
5 62 OF 41.460250 2.031502 38.8 2075.6 88 0.64 ± 0.04
5 63 OF 41.461701 2.030280 38.8 1090.3 156 1.26 ± 0.06
5 54 CNF 41.459399 2.029951 38.8 2603.8 93 0.74 ± 0.05
5 55 CNF 41.459423 2.029928 38.8 2608.0 96 0.57 ± 0.03
5 56 CNF 41.459432 2.030469 38.8 2627.8 57 0.44 ± 0.03
5 57 CNF 41.459471 2.030450 38.8 2635.9 50 0.49 ± 0.03
5 58 CNF 41.459520 2.030487 38.8 2634.5 80 0.79 ± 0.06
5 32 INF 41.464199 2.033289 38.8 784.0 173 0.30 ± 0.03
5 33 INF 41.463985 2.032720 38.8 837.3 252 0.60 ± 0.03
5 34 INF 41.464518 2.033005 38.8 820.3 119 1.64 ± 0.08
5 35 INF 41.464731 2.033612 38.8 545.7 169 0.91 ± 0.06
5 36 INF 41.464001 2.032494 38.8 855.3 81 0.93 ± 0.05

Chapter 4: Zero-sum landscape effects on acorn predation
79
Table 2. Effects of landscape connectivity (% forest cover), forest type (OF: old forest, CNF: connected new forest, INF: isolated new forest), tree connectivity (m2), acorn production (number acorns/tree) and
acorn size (cm3).
Overall Cydia Curculio C. elephas/
C.glandium
Embryo
survival
Random effects Variance SD Variance SD Variance SD Variance SD Variance SD
Tree: Site 0.609 0.780 0.696 0.834 0.818 0.905 0.713 0.845 1.88e-01 4.33e-01
Site 0.169 0.411 0.174 0.417 0.095 0.307 0.000 0.000 2.040e-14 1.43e-07
Fixed effects Estimate SE z Estimate SE z Estimate SE z Estimate SD z Estimate SD z
Intercept -1.681 0.209 -8.055*** -2.712 0.231 -11.726*** -2.019 0.284 -11.093*** -1.028 0.270 -3.811*** -2.805 0.180 -15.551***
Landscape connectivity 0.340 0.210 1.620 --- --- --- 0.332 0.183 1.816 -0.409 0.161 -2.536* --- --- ---
Forest type CNF --- --- --- --- --- --- -0.564 0.287 -1.961* 0.111 0.385 0.287 --- --- ---
INF --- --- --- -1.134 0.332 -3.419*** 0.919 0.436 2.105*
Tree connectivity 0.702 0.113 6.192*** 0.230 0.152 1.515 0.500 0.170 2.942** 0.584 0.189 3.084** -0.231 0.104 -2.217***
Acorn production --- --- --- -0.314 0.145 -2.162* --- --- --- --- --- --- --- --- ---
Acorn size 0.617 0.039 15.943*** 0.030 0.052 0.578 0.951 0.048 19.911*** --- --- --- 1.157 0.104 11.112***
Tree connectivity : Acorn size --- --- --- -0.1241 0.054 -2.299* 0.161 0.051 3.152** --- --- --- --- --- ---
Tree connectivity : Acorn production --- --- --- -0.270 0.163 -1.658 --- --- --- --- --- --- --- --- ---
Acorn size : Acorn production --- --- --- -0.206 0.061 -3.390*** --- --- --- --- --- --- --- --- ---
Parasite Cydia --- --- --- --- --- --- --- --- --- --- --- --- 0.715 0.191 3.752***
Both --- --- --- --- --- --- --- --- --- --- --- --- -0.605 0.407 -1.487
Chapter 4: Zero-sum landscape effects on acorn predation
80

Chapter 5: Genetic signature of dispersal vs. dormancy trade-off
81
Chapter 5: Do dispersal vs. dormancy strategies of tracking
unpredictable resources leave genetic signatures? A case of specialist
insects inhabiting patchy habitats.
RUIZ-CARBAYO, H., PINO, J., ESPELTA, J. M., HAMPE, A., BONAL, R.
Manuscript under preparation
Abstract
Spatial dispersal vs. dormancy are contrasting strategies exhibited by short-lived organisms for
coping with unpredictable pulsed resources in patchy and dynamic habitats. The trade-off
affect species demography and population genetics, with good dispersers showing weaker
genetic structure across patches while more resilient species being genetically poorer but
showing larger local population sizes. While effects on community assembly regarding species
distribution and abundance have been quite studied, genetic diversity and isolation of
populations along patch dynamics are mostly unknown. Genetics will, however, condition
population viability due to the relationship between genetic diversity and fitness. The present
paper addresses this subject in an area in which former croplands are being colonized by holm
oaks Quercus ilex, giving rise to a fragmented landscape with mature old forests, new oak plots
adjacent to mature forests and new isolated oak plots. Holm oak acorns are predated by two
specialist insects, Curculio glandium and Curculio elephas (Coleoptera: Curculionidae), which
exhibit different strategies (dispersal and dormancy, respectively) to track food availability.
Using mitochondrial and nuclear markers (single nucleotide polymorphisms) we assessed the
genetic signature left by those strategies in their populations. As expected, the poor disperser
C. elephas exhibited a significant population genetic structure among patches absent in C.
glandium. In C. elephas, gene-flow was constrained in new isolated oak patches, as their
isolation from mature forests and recent age hampers the arrival of immigrants. The
populations of C. elephas (the species with bet-hedging dormancy) went through bottlenecks
and their genetic diversity was lower than in C. glandium in all types of forest plots. The
populations of the poor disperser species were not threatened in forest fragments though, as
its populations were always more numerous probably thanks to a higher fecundity rate.

Chapter 5: Genetic signature of dispersal vs. dormancy trade-off
82
However, if more recurrent population bottlenecks this situation could change unless
landscape management policies promote habitat connectivity.
Keywords: Curculio, dispersal/dormancy trade-offs, dispersal ability, environmental
stochasticity, forest fragments, Quercus.
5.1 Introduction
Organisms that feed on pulsed resources have evolved different strategies to track
unpredictable food availability in space and time. Spatial dispersal and dormancy (i. e.
dispersal in time) are considered two of the main strategies exhibited by short-lived organisms
like insects for coping with environmental stochasticity, as both of them reduce the risk of
local extinction (Venable & Lawlor, 1980; Venable & Brown, 1988). Since both strategies are
highly energy demanding, the emergence of trade-offs between these strategies is expected
due to energetic constraints (Roff, 1986; Zera et al., 1997; Zera & Harshman, 2001). The
existence of dispersal/dormancy trade-offs favours the co-existence of species exploiting the
same pulsed resource, since they lower interspecific competition and this prevents any species
from completely outcompeting the rest (Amarasekare 2003).
In patchy habitats, dispersal vs. dormancy trade-offs condition local community composition
through their effects on species arrival likelihood and resilience. Species with great dispersal
ability will be better able to move between suitable patches (Baguette et al., 2003; Doligez &
Part, 2008, Ruiz Carbayo et al. 2017; 2018) than poor dispersers; however, increased dispersal
will only lead to larger populations if the immigrants permanently establish and successfully
reproduce in a patch. Conversely, poor disperser but more resilient species would be less likely
to arrive but also to become locally extinct. Species resilience will strongly depend on the
ability to circumvent temporal adverse conditions (i. e. dormancy). The balance between both
selective forces will rule the relative frequency of the species following one strategy or the
other (Amarasekare 2013; Ruiz-Carbayo et al. 2018)
Dispersal and dormancy will not only condition local species composition but also the
population genetics of the species following each strategy. This could in turn also affect the
viability of their populations, as genetic diversity is correlated with individual fitness
(Vrijenhoek, 1994; Saccheri et al., 1996; Liersch & Schmid-Hempel, 1998; Gilligan, 2001; Reed
& Bryant, 2001). Theoretically, species with higher dispersal ability would show a weak genetic
structure and a higher gene-flow across patches compared to poor dispersers, but local genetic

Chapter 5: Genetic signature of dispersal vs. dormancy trade-off
83
diversity would be higher due to the arrival of new immigrants (Hastings & Harrison 1994). In
turn, more resilient species could be less genetically diverse due to their lower dispersal
abilities, especially in very isolated patches, however, this could be counterbalanced by a
larger population size due to their lower likelihood to suffer local population bottlenecks
(Frankham 2005).
In the current context of Global Change, it is very important to assess how food-tracking
strategies condition species composition and population viability in organisms colonizing new
habitat patches. The appearance of new forest plots in former abandoned croplands is a
widespread phenomenon (especially in Europe) and a good example of a new patchy habitat
(Basnou et al. 2016)(Gerzabek et al. 2017). The species composition of new forest patches
depends on their degree of isolation and age; poor dispersers will less likely reach new habitat
patches far from old ones (sources of new immigrants). The effects of patch age and isolation
on species composition have been studied in different taxa (Jeffries et al., 2006; Maldonado-
López et al., 2015; Ruíz-Carbayo et al. 2017, 2018). However, we know much less about the
genetic diversity and isolation of the new populations (but see Arias-Leclaire et al. 2017) and to
which degree, depend on the species dispersal/resilience abilities. Yet, it may strongly affect
their fitness and local population viability in the mid-long term.
We used two weevil species Curculio glandium and Curculio elephas (Coleoptera:
Curculionidae), both specialist predators of oak Quercus spp. acorns, as study models to assess
the effects of patch isolation and age on the genetic structure and diversity of their
populations in new oak forests in Catalonia (north-eastern Spain). In Western Europe the
appearance of new forests is an ongoing process that started some decades ago with the
abandonment of agricultural lands; e.g. in our study area forest surface has increased in 20% in
the last 50 years (Baśnou et al. 2013). The holm oak Quercus ilex is one of the most prevalent
tree species in forest patches, which could be divided in: mature (i. e. old) forest plots, new
forest patches adjacent to mature forests and new and isolated forest patches. The weevils
Curculio elephas and Curculio glandium are the most important pre-dispersal acorn predators
in Iberian Holm oak forests, being the most prevalent species in these NE Spain forest patches
(Espelta et al. 2009a). They are trophic specialists, as their larvae can only develop within oak
acorns (Desouhant et al., 2000; Bonal et al., 2007; Pélisson et al., 2011; Venner et al., 2011).
The production of acorns vary greatly, both temporally and spatially (Espelta et al.,
2008;Venner et al., 2011; Pélisson et al., 2013), what makes it an unpredictable food resource.

Chapter 5: Genetic signature of dispersal vs. dormancy trade-off
84
These insects have evolved both temporal and spatial risk-spreading strategies in order to cope
with this resource stochasticity. C. glandium has greater dispersal abilities than C. elephas; the
maximum dispersal distances have been estimated to be 1200 m in the former and 600 m in
the latter. Also, C. glandium adults emerge from their overwintering underground refuges in
spring and have several months to search and disperse to high-quality habitat patches for
feeding and egg-laying before the acorns start growing in September. By contrast, C. elephas
adults emerge in late summer and mate and oviposit soon after (Pélisson et al. 2013a), so that
adult dispersal within the tree under which they emerge is the rule (Coutin, 1960; Debouzie et
al., 1996), especially if trees are isolated (Menu & Debouzie, 1993;Bonal et al., 2012). In turn,
C. elephas has a higher ability to cope with local stochasticity of food resources. The diapause
of C. glandium has a fixed duration of two years, whereas in C. elephas diapause is variable and
may last from one to three years (Pélisson et al. 2013b). This means that, despite the arrival of
immigrants is less likely in C. elephas, this species will presumably better withstand temporal
local scarcity of food resources as some individuals will emerge when the environmental
conditions improve (Menu & Debouzie 1993). Besides, C. elephas is larger sized and larval
survival is higher than in C. glandium (Bonal et al. 2011), what could also make it less likely to
suffer local extinction.
Because C. elephas is more likely to escape poor conditions temporally, while C.
glandium is more likely to do it spatially, landscape features can impact their colonization
dynamics differently. Ruiz-Carbayo et al. 2018 revealed a distance-decay pattern in C. elephas
populations from old mixed-forests to new recently established ones, with significant
colonization credits in the most isolated new forests, while no significant effects of forest age
and connectivity were detected for C. glandium. In this study we used two different types of
genetic markers (mitochondrial DNA and nuclear single nucleotide polymorphisms) to assess
the genetic signature that these contrasting dispersal strategies leave in the populations of
both species. The effects on the population genetics of the species could condition the viability
of the populations of these insects which, together with moth caterpillars (Ruíz-Carbayo et al.
2017), are at the base of the trophic chain as primary consumers feeding on oaks.
We specifically tested: i) whether population genetic structure differed between species ii)
whether gene-flow and genetic diversity were lower in isolated new forest patches and
whether it differed between species. We hypothesized that genetic structure would be less
marked in C. glandium due to a stronger gene-flow among populations favoured by its higher
dispersal abilities. Gene-flow between new isolated forests and the rest would be expected to
be lower than in the case of new patches connected to old forests, especially in the case of the
Chapter 5: Genetic signature of dispersal vs. dormancy trade-off
85
poor disperser C. elephas. Regarding genetic diversity, it could be higher in C. glandium
although a larger population size in C. elephas resulting from its higher resilience could
compensate for a lower arrival of immigrants.
5.2 Material and methods
5.2.1 Study area and species
The sampling was carried out in the Vallès lowland (Barcelona, Spain, 41° 33′N, 2° 2′E) (see
Fig.1) in 2014. Climate is Mediterranean, with annual average rainfall about 650 mm and mean
temperatures ranging from 6°C in winter up to 23°C in summer. The landscape is a mosaic of
croplands, urban areas and forest patches dominated by pinus (Pinus pinea L., Pinus halepensis
MiLL.) and oaks (Quercus ilex L., Quercus pubescens LMiLL.). In the last decades forest surface
has increased at the expense of croplands in many parts of the Iberian Peninsula. In our study
area the Holm oak Q. ilex has successfully colonized abandoned agriculture lands since 1950s,
forming new oak patches more or less connected with mature forest stands (Basnou et al.
2016). The Holm oak Quercus ilex exhibits a marked inter-annual variability in seed-production
synchronized at the population level (Espelta et al. 2008). Acorns mature in one year and are
attacked by weevils of the genus Curculio spp. (Coleoptera: Curculionidae): Curculio elephas
and Curculio glandium are the most prevalent pre-dispersal acorn predators in our study area
(Espelta et al. 2009a; Bonal et al. 2011).
In early autumn acorns have grown to a size that allows oviposition by females of both species
(Espelta et al. 2009a; Bonal et al. 2011). Weevil females perforate the seed coat with their
specialized long rostrum, introduce the oviscapt through the puncture and oviposit into the
acorn. Commonly a single egg is laid per acorn, but larger clutches have eventually been
recorded (Bonal & Muñoz 2009). Weevil larvae have to complete their development (it lasts
around 35 days) within a single acorn feeding on the cotyledons (Bonal et al. 2010). Oaks drop
infested acorns prematurely and when larvae finish their development they drill an exit hole
through the acorn coat and bury underground to overwinter within an earth chamber. Larvae
undergo a diapause of variable duration depending on the species. In C. glandium larvae spend
two years buried before pupating and emerging to the surface as adults, whereas in C. elephas
diapause has a variable length and larvae of the same cohort may emerge as adults after one,
two or three years (Soula and Menu 2003; Venner et al. 2011; Pélisson et al. 2013a). Adult
emergence takes place in spring in C. glandium and in late-summer/early autumn in C. elephas.
In C. elephas rainfall amount strongly conditions adult emergence in Mediterranean
Chapter 5: Genetic signature of dispersal vs. dormancy trade-off
86
environments, as adults depend on the rain to soften the soil after the summer drought and be
able to emerge to the surface (Espelta et al. 2017). Dispersal abilities also differ between
species, being higher in C. glandium (1200 m vs 600 m in C. elephas). However, these
maximum dispersal distances were estimated in captivity (wind tunnel experiments in Pélisson
et al. 2013b) and might be lower in nature.
5.2.2 Experimental design
In order to sample forests of different age and connectivity, in autumn of 2014 we selected 18
stand forests grouped in 6 different sites (Fig. 1). Within each site, patch selection was made
based on the comparison between 1956- and 2009- land cover maps and orthoimages, which
allowed us to identify patches already present in 1956- (hereafter called “old forests”) and
subsequent patches (hereafter called “new forests”). Since patches in the study are rarely
isolated further than 600 m, we set this distance as a threshold to distinguish between
connected vs. isolated new forests. We calculated patch connectivity applying 600-m radius
buffers of 20% of forest cover on the orthoimages, which allowed us for the identification of
connected new forests (CNF) and isolated new forests (INF). Old forests (OF) in the study area
are present as large continuous patches, so no distinction in connectivity was made.
Sampling started in late August 2014, when we randomly selected five seed-producing trees
within each forest patch. (i.e. 90 in total) We carried out three sampling events, covering the
beginning, peak and end of the acorn season, as phenology differs between weevil species in
some extent (Bonal et al. 2011). From each oak, we gathered a random sample of 30 acorns in
each event (i.e. a total of 90 acorns) and once at the laboratory, we separated them into sound
and infested acorns, according to the absence/presence of Curculio oviposition scars. Acorns
were unequivocally identified following a unique numbering system, laid in individual trays and
checked every two days for emerged larvae (Bonal & Muñoz 2009). Since larvae of C. elephas
cannot be distinguished from larvae of C. glandium by morphological traits, we preserved
them in 99% ethanol and stored them at low temperature (4ºC) for further genetic analysis.
5.2.3 Molecular laboratory methods
We selected a subsample of 540 larvae (10 per sampling event and forest patch) for genetic
analysis. We extracted DNA from a small piece of larval tissue (approx. 2mm) using
NucleoSpin® Tissue (MACHEREY-NAGEL GmbH and Co. KG, Düren, Germany) according to the

Chapter 5: Genetic signature of dispersal vs. dormancy trade-off
87
manufacturer. As species identity cannot be determined in these species based on larvae’s
morphological traits, we carried out specific identification of individuals using molecular
techniques (DNA barcoding). We sequenced a fragment (826-bp) of the mitochondrial gene
cytochrome oxidase subunit 1 (cox1) and compared the obtained sequence with reference
sequences from previously identified individuals (see Bonal et al. 2011 for a similar approach).
Cytochrome oxidase subunit 1 (cox1) was amplified via PCR using the Pat and Jerry primers
following methods described in Hughes & Vogler, 2004. 14 µL PCR reactions contained 1.5 µL
of template DNA sample, 11.2 µL of double-distilled water, 1.5 µL of PCR buffer, 0.6 µL of
MgCl2, 0.25 µL of deoxyribonucleotide triphosphate (100 mmol/L), 0.2 of each primer (10
µmol/L) (forward [F] and reverse [R]), and 0.06 µL of Taq polymerase (Linus). PCRs were run in
a PTC-100® Thermal Cycler (Bio-Rad Laboratories, Hercules, California) under the following
conditions: a 9 min denaturation at 95ºC, 40 cycles of 30 s denaturation at 94ºC, a 45 s
annealing at 50ºC, and 45 s min elongation at 72ºC, with a final extension step of 10 min at
72ºC. The presence of the 826-bp DNA fragment in the sample was determined by
electrophoresis on 3% (w/v) agarose gels with 1× Tris–borate–EDTA buffer at a voltage of 60 V
during 25 min and 70 V for 15 min. Next, we looked for the DNA band in the agarose gel
stained with 0.005% Midori Green nucleic acid staining solution. Sequencing was performed
using Big-Dye (Perkin-Elmer) technology and an ABI3700 sequencer. We accomplished forward
and reverse strand editing with SEQUENCHER 4.1 (Gene Codes Corp., Ann Arbor, MI, USA), and
aligned with CLUSTALW supplied via http://align.genome.jp. We collapsed alignment sets into
unique haplotypes and compared them to the Curculio spp. reference sequences available for
Holarctic Curculio (Hughes & Vogler 2004) at GenBank. The comparison showed that the
sequences belonged either to C. elephas or C. glandium. The raw genetic divergence (total
number of differences divided by the total sequence length) between our samples and the
corresponding reference sequences was consistently below 2%. In turn, this intra-specific
divergence was much lower than the divergence between the two species (Bonal et al. 2011).
We used mtDNA not only for species identification, but also in analyses of the genetic
structure, gene-flow and genetic diversity. Even though mt-DNA is quite preserved, previous
studies have shown that in Curculio spp. it exhibits enough variability at spatial scales of just a
few kilometers (Toju & Sota, 2006; Toju et al., 2011; Arias-LeClaire et al. 2017).
Besides mtDNA we used nuclear markers, namely SNPs (Single Nucleotide Polymorphisms),
which could potentially provide a finer resolution at smaller spatial scales. Genomic DNA was
quantified using a Qubit Fluorometer (Invitrogen). We carried out sample dilutions to 20 ng/lL
using Biomek® NXP Laboratory Automation Workstation (Beckman Coulter). DNA of four

Chapter 5: Genetic signature of dispersal vs. dormancy trade-off
88
larvae from four different populations was isolated, tagged and pooled before next-generation
sequencing on the Ion Torrent PROTON system. About 10Gb of data were generated and
analyzed using the Ion Torrent Suite Software to detect SNPs distributed across the genome.
Using stringent technical (depth of coverage >10x) and biological (high heterozygosity) criteria,
we selected in silico a subset of 160 SNPs to genotype 96 individuals using the Mass Array
Sequenom iPLEX Gold assay (Sequenom 2008) at the Genome Transcriptome Facility of
Bordeaux (PGTB). The scatter plots of all genotyped SNPs were inspected using TYPER 4.0 and
a subset of 80 di-allelic SNPs were chosen according to their amplification success and
polymorphism across individuals. These 80 SNPs, arranged in two multiplexes of 40 SNPs each,
were used to genotype all the samples.
5.2.4 Molecular analyses
We calculated for each C. elephas and C. glandium populations the following standard
molecular indexes using mtDNA: haplotype richness, gene diversity (H) and nucleotide
diversity (π). We also tested the signature of recent population bottlenecks or expansions by
means of neutrality tests such as Tajima’s D (Tajima 1989) and Fu’s Fs (Fu 1997). In addition,
for each study site and species we plotted haplotype networks with the haploNet function of
the pegas package (Paradis 2010) in R to illustrate the effects of such demographic events on
the population genetics. For each species we removed from the analyses all populations with
less than 5 individuals (Papadopoulou et al. 2011). According to this criterion, all 18
populations of C. elephas where suitable for analysis whereas only 12 C. glandium populations
remained (see Table C.1). In the case of SNPs we calculated observed heterozygosity (Ho) and
expected heterozygosity (He) ant tested for deviation from Hardy-Weinberg equilibrium. All
analyses were performed using ARLEQUIN software (Excoffier et al. 2005).
To quantify gene flow between populations, pairwise FST (Wright 1931) were
estimated using ARLEQUIN software. FST significance was evaluated by means of a permutation
test, with 1000 permutations. Associations between geographic and genetic distance (isolation
by distance) were tested in both species using a Mantel’s test. As genetic matrix we used the
population pairwise FST yielded by ARLEQUIN, and a simple Euclidean distance matrix for
geographic distances. The Mantel test was run for 1000 permutations to test for significance.
Both distance matrices were calculated using the R package ecodist.
We tested the existence of significant population genetic structure with analyses of the
molecular variance (AMOVAs) using ARLEQUIN software (Excoffier et al. 2005). To assess the

Chapter 5: Genetic signature of dispersal vs. dormancy trade-off
89
existence of geographical patterns in the genetic structure we performed analyses using the
software SAMOVA 1.0 (Dupanloup et al. 2002). We simulated different number of populations
(K) ranging from K = 2 to 17 for C. elephas and K = 2 to 11 for C. glandium, looking for the
optimal grouping option that maximizes the among-group component (FCT) of the overall
genetic variance.
In addition, we carried out a complementary analysis for the nuclear SNPs using STRUCTURE
software (Pritchard et al. 2000) to also estimate the number of discrete genetic populations (K
values) supported in the data, and check the congruence of both methods. The program
STRUCTURE implements a Bayesian approach for inferring population structure from
multilocus data by several models, including the no-admixture model, which assumes that
each individual has inherited all its ancestry from a single population. We carried out analyses
with most parameters set to their default values as advised in the user’s manual of structure
2.0 (Pritchard & Wen 2003).
5.2.5 Statistical analyses
Linear Mixed Models (LMMs) were built to test for significant differences in population size
(number of individuals) between forest types and species. Also by means of LMMs we tested
the effects of population size, species and forest type on haplotype richness, gene diversity
and nucleotide diversity. Saturated models included second-degree interactions of predictors.
In addition, we evaluated whether the age and the degree of isolation of the patches had an
effect on genetic flow. Within each study site we set three different types of pairwise
comparisons: between old forests and connected new forests (OF-CNF), old forests and
isolated new forests (OF-INF) and between connected and isolated new forests (CNF-INF). We
assessed whether gene-flow differed depending on the type of pairwise comparison and
whether it differed between the two species; the interaction between both factors was also
tested. We used the inverse of pairwise population FST following a precise criterion (FST
negative values converted to zero values) as a proxy of gene-flow. Models were performed
with lmer function as implemented in the lme4 package. Model selection consisted of a
backward selection procedure in which less significant variables, based on the output of the
anova function (package lmerTest), were progressively eliminated from the saturated model.
Validation of the model included calculation of coefficient of determination (R2) and normality
of model residuals.
5.3 Results

Chapter 5: Genetic signature of dispersal vs. dormancy trade-off
90
5.3.1 Demography and parameters of genetic diversity
Curculio elephas was the most abundant species in our study area, the mean number of
individuals per patch was significantly higher than that of Curculio glandium (t = 4.53; P <0.001;
see Fig. 2). C. elephas was the most prevalent species irrespective of the age and the isolation
of the patch, as the interaction between the factors type of patch and species was not
significant (C. glandium * CNF: t = 0.77; P = 0.445 and C. glandium * INF: t = 1.08; P = 0.287;
see Table C.2).
The type of forest patch had a significant effect on haplotype richness values, which were
significantly higher in the old forests (OF) than in the isolated new ones (INF) (t = 5.97; P =
0.021; see Fig. 3); the mixed model explained 61% of variance of the response variable (Table
C.2). Haplotype richness per patch increased with the number of individuals but the increase
rate differed between species (Table C.2 and Fig. C.1). In C. glandium it increased more quickly
than in C. elephas, hence, despite the larger population sizes of C. elephas, the mean number
of haplotypes per patch did not differ between species (mean C. elephas: 4.00 ± 1.283; C.
glandium: 3.94 ± 1.731).
Contrary to haplotype richness, genetic and nucleotide diversities differed between species;
both were higher in C. glandium (Fig. 4 and Table C.3). In the best models only the factor
species was significant in the case of nucleotide diversity (t = 8.113, P < 0.001) and only
marginally significant for gene diversity (t = 1.915, P = 0.068; Table C.2) and. Nucleotide and
genetic diversity were higher in C. glandium despite the lack of differences in mean haplotype
richness because in C. elephas the genetic divergence among haplotypes is very low. The
haplotype networks illustrate this low divergence very well (Fig. 5). In C. elephas most
populations are dominated by one or few haplotypes and most of the less frequent ones differ
from them in just one nucleotide base pair. The result is the “star-like” network typical of the
populations that have gone through population bottlenecks. Accordingly, Fu´s FS parameter
was negative and significant in 6 forest patches for C. elephas (5 of them old forests), what
means that there is a departure from neutrality (excess of rare haplotypes close to the most
prevalent one in terms of genetic divergence). Those weevil populations would be going
through a recent population expansion after a bottleneck. In C. glandium, by contrast, neither
of the two neutrality tests carried out (Tajima´s D and Fu´s FS) retrieved significant values at
any of the populations (Table 1).
5.3.2 Dispersal and population genetic structure

Chapter 5: Genetic signature of dispersal vs. dormancy trade-off
91
The analysis of molecular variance (AMOVA) using mitochondrial DNA showed that there was a
significant population structure in the poor disperser C. elephas. The differences among
populations explained 10.5% of the total genetic variance taking all (18) forest patches and
12.3% when only the 12 patches that could also be used in the analysis for C. glandium were
considered. By contrast, in C. glandium no significant population structure was found (Table 2)
due to the higher gene-flow among patches. The SAMOVA analysis did not retrieve any
significant geographic genetic structure above the population level (P>0.05).
Gene-flow for the mt-DNA marker was significantly greater in C. glandium than C.
elephas, according to its higher dispersal ability (Fig. C.2). The analyses of gene-flow at a finer
spatial scale among the three patches of each of the 6 study sites, showed that gene-flow is
restricted in some of the newer and more isolated forest patches (INF) in C. elephas. Using
mitochondrial DNA, the pairwise Fst values were significant in three of the study sites in the
comparisons between old forests (OF) and isolated new forests (INF) in C. elephas, whereas in
the rest of the contrasts for C. elephas and in all contrasts for C. glandium they did not differ
significantly from zero. Using finer nuclear markers (SNPs) we found more significant pairwise
FST values that confirmed the trend detected using mitDNA. Contrasts between OF and INF
were significant in all (6) study sites, while CNF-INF and OF-CNF comparisons showed
significance only in three and two sites respectively (Table C.4). This result was supported by
the greater pairwise FST values found for OF-INF when compared to OF-CNF (t = -2.480, P =
0.027; see Fig. C.3). We could not carry out this analysis in C. glandium because the SNPs did
not work in this species (reduced amplification success and very low levels of polymorphism).
The STRUCTURE analysis analyses based on SNPs revealed the existence of 2 or 3
genetic clusters depending on the study site (Fig. 6). However, despite the significant FST values
that showed a significant gene-flow restriction in INFs, the genetic structuring between OF,
CNF and INF was not clearly seen at all study sites. Only in some cases, like the study site 1,
differences are evident, as half of the individuals of the INF belong to a genetic cluster (purple)
were almost absent in the OF and CNF. The same was observed in Site 3, in which in the INF
there was a mix of individuals of different genetic clusters whereas the OF was dominated by
individuals of one of them (“the yellow cluster”). The genetic structuring would be the result of
the restricted gene-flow between patches.
5.4 Discussion
Chapter 5: Genetic signature of dispersal vs. dormancy trade-off
92
The different strategies evolved by C. glandium and C. elephas to track food availability in a
fragmented landscape have left a distinct genetic signature in their population genetics. C.
glandium has better dispersal abilities (Pélisson et al. 2013b) and, accordingly, we did not find
among populations the significant genetic structuring that we recorded in the poor disperser C.
elephas. In this species gene-flow restriction was higher in new and isolated forest patches
compared to new patches close to mature forest plots. Genetic diversity was higher in C.
glandium compared to C. elephas but, contrary to our expectations, it was higher in all types of
forest plots, not only in isolated new ones. Contrary to C. glandium, C. elephas can spread
dormancy (i. e. dispersal in time) and persist in all types of patches, and so it was, in fact, the
most abundant species practically in all plots. Yet, neutrality tests show that its populations
went through marked population bottlenecks even in mature forest patches.
The lack of genetic structuring among populations in C. glandium agrees with its higher
potential dispersal abilities (Pélisson et al. 2013b, Arias-Leclaire et al. 2017) and with the even
and non-constrained dispersion of this species within the forest mosaic found for this species
in previous works (Ruiz-Carbayo et al. 2018). Potential dispersal abilities in C. glandium double
those of C. elephas (1200 vs. 600 m) what, given the distance among forest patches in our
study area (Baśnou et al. 2013; Vilà-Cabrera et al. 2017), means that there are not dispersal
barriers for C. glandium. According with a lower dispersal ability, gene-flow restrictions in C.
elephas (measured either with mitochondrial DNA or SNPs), were higher in isolated new
forests.
The maximum potential distance recorded in C. elephas (600 m) would, however, be high
enough to avoid gene-flow constrains. The reason for these apparent incongruences could be
the previous methods of measuring dispersal distances and the phenology of the species. The
dispersal distances reported by Pélisson et al. 2013 correspond to wind-tunnel measurements
what means that, if well weevils are physically able to fly over those distances, they may not
actually do it in the field. Moreover, a later phenology may constrain dispersal in C. elephas;
the adults of this species emerge in late summer from their underground earthen cells,
whereas in C. glandium emergence occurs in spring (Pélisson et al. 2012; Espelta et al. 2017).
C. glandium is a synovigenic species and adults spend several months in the trees before
mating when acorns are available for oviposition in autumn. By contrast, C. elephas is
proovigenic and females oviposit as soon as they mate just after emergence (Pélisson et al.
2012; Arias-LeClaire et al. 2017). C. elephas females may thus be time constrained to achieve
their full potential fecundity (Desouhant et al. 2000b) what would prevent investing time in
dispersal and thus, ultimately, reducing gene-flow among forest patches.

Chapter 5: Genetic signature of dispersal vs. dormancy trade-off
93
The higher genetic diversity in C. glandium suggests that the higher potential local
resilience of C. elephas does not compensate for its lower dispersal abilities. The variable
dormancy (i. e. variable length diapause) of C. elephas means that not all the larvae of the
same cohort emerge after a fixed time period; rather, they may spend from one to three years
in their underground refuges (Soula & Menu 2003). This strategy increases female fitness, as
some of the offspring will be able to skip unfavorable years, and favors local population
resilience against the dramatic inter-annual variability of acorn production (Crawley & Long
2008; Espelta et al. 2008). In fact, dormancy is common in many insect species that face
stochastic seasonal environments and need to cope with unfavorable conditions (Kivelä et al.
2016). However, the low genetic diversity observed, the results of the neutrality tests and the
shape of the haplotype networks, show that dormancy does not fully avoid population
bottlenecks in C. elephas. These bottlenecks, which also occur in mature forest plots, could be
provoked by the late phenology of this species. In the Iberian Peninsula, adult weevils depend
on rainfall to soften the soil and be able to emerge from their underground refuges (Espelta et
al. 2017), thus, the lack of late summer storms increases adult mortality and reduces C.
elephas numbers (Bonal et al. 2010; Bonal et al. 2015). Besides, prolonged diapause reduces
the risk of local extinction, but it might reduce population genetic diversity too (Suez 2012).
Most individuals go through a one-year diapause (Pélisson et al. 2012), hence, if well an
unfavorable year will not provoke total extinction, the effective population size will decrease.
C. glandium will be less susceptible to the lack of rainfall because adults emerge in spring,
before summer drought (Espelta et al. 2017). Also, despite their lower resilience (i. e. no
variable length diapause), C. glandium higher dispersal abilities will facilitate recurrent
colonization events from different patches, what will increase local genetic diversity (Chen et
al. 2006; Roman 2006).
The larger but less genetically diverse populations of C. elephas suggest quick population
growths. According to neutral theory, larger population size should support greater genetic
diversity due to a decrease in the effects of genetic drift (Kimura 1983). However, C. elephas
populations were less diverse than those of C. glandium and have gone through bottlenecks
that could not be compensated by the arrival of immigrants due to its poor dispersal abilities
(Pélisson et al. 2013a). The higher numbers of C. elephas in almost all forest patches could be
explained by a higher fitness that might promote a stronger population growth. Curculio
elephas is larger-sized than C. glandium, and body size is a key life-history trait in insects
strongly related with individual fitness (Partridge & Farquhar 1983; Desouhant et al. 2000;
Berger et al. 2008; Bonal et al. 2011). Larval survival is higher in C. elephas in oak forests where

Chapter 5: Genetic signature of dispersal vs. dormancy trade-off
94
both species co-exist and larval size is correlated with adult size (Bonal et al. 2011). In turn,
adult body size is correlated with potential fecundity; larger females lay more eggs in C.
elephas (Desouhant et al. 2000a), and such relationship between body size and potential
fecundity might hold at the inter-specific level between C. elephas and C. glandium. In fact,
inter-specific comparisons among closely related species of butterflies have shown that larger
sized species have a higher potential fecundity (number of eggs) than small sized ones (García-
Barros 2000). These fitness advantages associated with a larger body size have been argued to
underlie the inter-specific morphological diversification in acorn Curculio spp. (Hughes &
Vogler 2004).
One of the limitations of our study is that we could not use nuclear markers (SNPs) in the case
of C. glandium. Inter-specific comparisons based on mitochondrial DNA could be biased, as
these genes are maternally inherited and strictly reflect female movements, what could be
misleading in case of dispersal differences between sexes (Scribner et al. 2001)(Petit &
Excoffier 2009). However, the concordance between mitochondrial and nuclear markers in C.
elephas (higher gene-flow restriction in isolated new forests) suggest that such discordances
do not exist in this species and have not likely affected the results of the comparisons between
species.
C. elephas and C. glandium follow different strategies to track a pulsed food resource (i. e.
acorns) what, in a fragmented landscape, conditions the relative frequencies of one or the
other species according to the age and degree of isolation of the oak forest patch (Ruiz-
Carbayo et al. 2018). Our results show that C. glandium, better able to track food in space, will
easily colonize new and isolated forest plots and maintain a high genetic diversity. In C.
elephas, dormancy (i. e. dispersal in time) does not make this species less vulnerable to
eventual local food shortage, as it will go through bottlenecks further aggravated by the scarce
arrival of immigrants (restricted gene-flow). The lower genetic diversity would be expected to
lessen the resilience of populations to environmental perturbations (Frankham et al. 2002;
Reed & Frankham 2003). Yet, C. elephas maintained large, but genetically poorer populations,
probably due to a higher population growth favored by a higher fitness associated to its larger
body size compared to C. glandium. In mature forest plots, a higher fecundity allows a quick
recovery after a sharp population decline; in new isolated oak patches it would permit a quick
population growth starting from a low number of new immigrants. The populations of the
poor disperser species are thus not threatened in forest fragments, however, the situation
could change if forecasted scenarios of more frequent drought episodes occur (Lionello et al.
2006). The vulnerability of C. elephas to drought could provoke more recurrent population

Chapter 5: Genetic signature of dispersal vs. dormancy trade-off
95
bottlenecks from which its populations could not easily recovered unless connectivity is
favored by the presence of isolated oaks that could act as stepping stones among forest
patches (Manning et al. 2006).
Acknowledgements
We are grateful to Dr. Miquel Riba and Dr. Víctor Granda for their statistical advice. We also
thank Raquel Ubach for her help with the spatial treatment of data in ArcGIS. This research
was supported by the FORASSEMBLY (CGL2015-70558-P), SPONFOREST (APCIN_2016_0174).
PLAGANADO (AGL2014-54739-R) and MOLWEEVIL (Trees4Future). Furthermore, HR was
funded by a pre-doctoral grant (BES-2013-065741) and the complementary grant for short
internships (EEBB-I-17-12542) of the Spanish Ministry of Economy and Competitiveness, and
RB was funded by a contract from the Atracción de Talento Investigador Programme (Regional
Government of Extremadura).

Chapter 5: Genetic signature of dispersal vs. dormancy trade-off
96
Figure 1. Location of the study site. Top left: Context and study site. Bottom left: Sample locations. Centre and right: One of the replicates as an example of the experimental
design, in a 1956- American flight image (centre) and a 2005- orthoimage (right).

Chapter 5: Genetic signature of dispersal vs. dormancy trade-off
97
Figure 2. Population size per patch for two weevil species: C. elephas and C. glandium. Boxplots represent median,
25th, and 75th percentiles, respectively. White circles represent mean population size. Black circles represent outliers.
Figure 3. Boxplot illustrating haplotype richness by forest type (OF: old forest, CNF: new connected forest and INF:
isolated new forest). Different letters indicate significant differences. Box plots show minimum, lower quartile,
median, upper quartile and maximum values. Means are depicted as white dots.

Chapter 5: Genetic signature of dispersal vs. dormancy trade-off
98
Figure 4. Boxplots illustrating differences in gene (a) and nucleotide (b) diversities between C. elephas and C.
glandium. Box plots show minimum, lower quartile, median, upper quartile and maximum values. Means are depicted
as white dots.

Chapter 5: Genetic signature of dispersal vs. dormancy trade-off
99
Figure 5. Parsimony network for mtDNA haplotypes of C. elephas and C. glandium in each study site. The size of the
circles represents haplotype frequencies in each site. Bars represent unique mutation steps.

Chapter 5: Genetic signature of dispersal vs. dormancy trade-off
100
Figure 6. STRUCTURE graphs. Colors refer to different genetic clusters. Bars from top to bottom of the graphs
represent % cluster membership of each C. elephas individual. Forest code: OF (old forest), CNF (connected new
forest) and INF (isolated new forest).
Site 1 Site 2 Site 3
Site 4 Site 5 Site 6
OF CNF INF OF CNF INF OF CNF INF
OF CNF INF OF CNF INF OF CNF INF

Chapter 5: Genetic signature of dispersal vs. dormancy trade-off
101
Table 1. Tajima’s and Fu’s neutrality tests for 825-bp COI sequences of C. elephas and C. glandium in six study sites. Significant values are highlighted in yellow.
Statistics B_INF B_CNF B_O
F
C_INF C_CNF C_O
F
H_INF H_CNF H_OF I_IN
F
I_CNF I_OF M_INF M_CNF M_OF V_INF V_CNF V_OF Mean s.d.
C. elephas
Tajima's D
test
Sample size 9 9 12 10 20 18 12 22 14 21 11 17 6 11 18 21 14 20 14.722 4.84
S 3 2 3 1 2 4 1 2 3 3 2 4 3 7 4 3 4 3 3 1.33
Pi 1.11 0.72 1 0.47 0.61 0.64 0.17 0.46 1 0.89 0.87 0.78 1.27 1.75 0.82 0.87 0.791 0.468 0.82 0.34
Tajisma's D 0.03 -0.06 0.02 0.82 0.17 -1.35 -1.14 -0.37 0.18 0.16 0.85 -1.04 -0.19 -1.09 -0.88 0.10 -1.222 -1.191 -0.34 0.69
Tajima's D
p-value
0.56 0.37 0.58 0.87 0.65 0.08 0.16 0.36 0.64 0.60 0.83 0.21 0.4 0.16 0.24 0.59 0.128 0.087 0.42 0.25
Fu's FS test
No. Alleles
(unchecked
)
3 3 7 2 3 5 2 3 4 4 3 5 4 5 5 5 5 4 4 1.25
Theta_pi 1.11 0.72 1 0.47 0.61 0.64 0.17 0.46 1 0.89 0.87 0.78 1.27 1.75 0.82 0.87 0.79 0.47 0.82 0.34
Exp. No. Of
alleles
2.97 2.44 3.10 2.08 2.74 2.75 1.47 2.42 3.25 3.41 2.83 3.01 2.69 3.95 3.15 3.37 2.88 2.40 2.83 0.54
FS 0.55 -0.24 -5.06 0.82 0.15 -2.44 -0.48 -0.31 -0.42 -0.24 0.32 -1.99 -1.35 -0.71 -1.76 - -2.24 -1.71 -1.03 1.37
FS p-value 0.62 0.35 0 0.54 0.45 0.01 0.12 0.31 0.36 0.39 0.48 0.02 0.06 0.26 0.05 0.11 0.01 0.04 0.232 0.20
C. glandium B_INF B_CNF B_OF C_INF C_CNF C_OF H_INF H_CNF H_OF I_INF I_CNF I_OF M_INF M_CNF M_OF V_INF V_CNF V_OF Mean s.d.
Tajima's D
test
Sample size 5 5 6 7 12 7 12 10 21 13 5 8 9.25 4.51
S 9 8 53 12 4 11 13 13 13 13 11 13 14.42 11.93
Pi 4 3.4 19.2
7
3.81 0.99 3.52 5.46 5.33 5.51 4.74 4.8 7.07 5.66 4.35
Tajisma's D -0.53 -0.81 -1.09 -1.21 -0.90 -1.16 1.13 0.73 1.88 0.55 -0.65 2.08 0.00 1.16
Tajima's D
p-value
0.42 0.30 0.15 0.12 0.21 0.15 0.91 0.80 0.98 0.77 0.34 1.00 0.51 0.34
Fu's FS test
No. Alleles
(unchecked
3 4 5 4 4 4 5 6 7 6 5 3 4.67 1.18

Chapter 5: Genetic signature of dispersal vs. dormancy trade-off
102
Table 2. Detailed variance analyses (AMOVA) for the two weevil species for all (18) populations in the case of C. elephas and for 12 populations in C. elephas and C.
glandium.
C. elephas C. glandium
Variance among populations (18) 0.0469 -
FST 10.5% -
P < 0.001 -
Variance among individuals within
populations
0.3987 -
FIS 89.5% -
P - -
Variance among populations (12) 0.0662 0.1533
FST 12.3% 5.6%
P < 0.001 0.063
Variance among individuals within
populations
0.4735 2.5960
FIS 87.7% 94.4%
P - -
)
Theta_pi 4 3.4 19.2
7
3.81 0.99 3.52 5.46 5.33 5.51 4.74 4.8 7.07 5.66 4.35
Exp. No. Of
alleles
3.54 3.39 5.34 4.32 3.08 4.21 6.70 5.97 9.06 6.64 3.69 5.63 5.13 1.70
FS 1.87 -0.13 1.91 1.15 -0.65 0.98 2.46 0.54 2.17 1.13 -1.41 5.22 1.27 1.64
FS p-value 0.84 0.35 0.74 0.72 0.21 0.69 0.88 0.58 0.86 0.71 0.10 0.98 0.64 0.27
Chapter 6: General discussion
103
Chapter 6: General discussion
In this thesis I have addressed diverse aspects of the assembly of the herbivore insect
community in Quercus ilex forests and the resulting effects of this plant-animal interaction for
the host trees. Using a spatially explicit approach at contrasting scales, we have explored both,
genetics and specific composition of some species (i.e. Curculio spp.) and communities (i.e.
lepidoptera), as well as the intensity of folivory and granivory, in relation with species’ life
history traits, landscape context and their interaction. We have found that, in the studied
context of land-use change and forest patch recovery in former agricultural areas, neutral
processes are playing a particularly important role in assembling the community of insects and
their interaction with Quercus ilex at landscape scale, as partially suggested by previous works
on plant species assemblages (e.g. Basnou & Pino 2015; Basnou et al. 2016). As mentioned
above, the spatial component -quite unexplored by now- has been thoroughly studied in the
present thesis, with dispersal ability and habitat connectivity becoming key traits for the
abundance and composition patterns observed, as well as the genetic structure and variability
of herbivore populations.
Furthermore, the effect of time has been commonly overlooked in the literature on
community ecology owing, partly, to the restriction of time-limited spatial data sets. Thus, we
have successfully added the effect of time, simply comparing pre-existing and recent forests
detected from land cover change maps, to the spatial effects of landscape (regional), patch
(local) and tree (individual) scales. Results show that habitat age is as important as spatial
attributes at structuring communities and biotic interactions in these new habitats; the
herbivore community of Q. ilex in new forests is becoming assembled, at least to some extent,
according to tree characteristics such as canopy size, connectivity and age. The interaction
between these inherently spatiotemporal characteristics make well-structured, well-connected
and mature holm oaks, into refugees of more abundant, richer and more diverse Lepidoptera
communities (Chapter 2). Other characteristics such as tree genotype determines leaf chemical
and physical defenses, and therefore, the quality and palatability of the host plant can also be
a modulator of plant resistance/susceptibility to herbivory (Solla et al., 2016). As a result,
uneven herbivory patterns can be observed within the same habitat patch, with some host
individuals being more heavily damaged by insect herbivores than others (Chapters 3 and 4).
Thanks to our integrative approach (Figure 1) we could prove how important interactions
between size, age, connectivity, genetics and location of the host, are in the assembly of the
herbivore community and the assembly of the resultant plant-animal interaction (herbivory).
At the patch scale, this heterogeneous pattern in herbivore assemblages can still be observed

among patches of different age and connectivity, with poor disperser insects gathering in old
and well-connected patches and exhibiting colonization credits in the new isolated ones, whil
insects with better dispersal abilities colonizing old and new, connected and isolated patches,
equally (Chapter 4). Nevertheless, habitat patches with different herbivore assemblages
exhibit similar acorn predation damage, in what we have identified as
landscape attributes on herbivory assembly as a result of compensatory dynamics among
species (Chapter 4). And at the landscape scale, this pattern of heterogeneous herbivore
assemblages and homogeneous herbivory damage, persist. This
left a genetic signature in the community, with a noticeable genetic structure among
populations and lessened local genetic diversity of the poor dispersers due to bottlenecks and
founder effects (Chapter 5).
Figure 1. Integrative approach followed in the thesis, considering the interaction of
spatiotemporal attributes of the landscape with species’ traits, in order to study the assembly
of a herbivore community and herbivory, in expanding habitats.
6.1 Islands in the stream: Assembly of a Lepidoptera community in an expanding savannah
like Quercus ilex landscape
Chapter 6: General discussion
among patches of different age and connectivity, with poor disperser insects gathering in old
connected patches and exhibiting colonization credits in the new isolated ones, whil
insects with better dispersal abilities colonizing old and new, connected and isolated patches,
equally (Chapter 4). Nevertheless, habitat patches with different herbivore assemblages
exhibit similar acorn predation damage, in what we have identified as a zero
landscape attributes on herbivory assembly as a result of compensatory dynamics among
species (Chapter 4). And at the landscape scale, this pattern of heterogeneous herbivore
assemblages and homogeneous herbivory damage, persist. This assembly process has already
left a genetic signature in the community, with a noticeable genetic structure among
populations and lessened local genetic diversity of the poor dispersers due to bottlenecks and
Integrative approach followed in the thesis, considering the interaction of
spatiotemporal attributes of the landscape with species’ traits, in order to study the assembly
of a herbivore community and herbivory, in expanding habitats.
: Assembly of a Lepidoptera community in an expanding savannah
General discussion
104
among patches of different age and connectivity, with poor disperser insects gathering in old
connected patches and exhibiting colonization credits in the new isolated ones, while
insects with better dispersal abilities colonizing old and new, connected and isolated patches,
equally (Chapter 4). Nevertheless, habitat patches with different herbivore assemblages
a zero-sum effect of
landscape attributes on herbivory assembly as a result of compensatory dynamics among
species (Chapter 4). And at the landscape scale, this pattern of heterogeneous herbivore
assembly process has already
left a genetic signature in the community, with a noticeable genetic structure among
populations and lessened local genetic diversity of the poor dispersers due to bottlenecks and
Integrative approach followed in the thesis, considering the interaction of
spatiotemporal attributes of the landscape with species’ traits, in order to study the assembly
: Assembly of a Lepidoptera community in an expanding savannah-

Chapter 6: General discussion
105
In Chapter 2 we’ve tried to shed some light on this information gap on the interactive effects
of species’ traits and landscape spatiotemporal attributes on the assembly of a Lepidoptera
community inhabiting holm oak (Q. ilex) trees in a savannah-like landscape emerged after
cropland abandonment. The importance of spatial connectivity on the distribution of herbivore
insects in patchy habitats, has been already highlighted in previous literature, where better
connected trees host higher abundances and herbivore richness in both, highly isolated trees
and trees embedded in closed mixed canopies (Gripenberg & Roslin 2005; Müller & Goßner
2007). This pattern has also been identified for other host species (e.g. grasses) and
ecosystems (e.g. tropical forests; Doak 2000; Ricketts et al. 2001), but the temporal dimension
of these habitats were overlooked in spite of the relationship that the colonization time
hypothesis establishes between species richness and the time a patch has been available for
colonization (Borges & Brown, 1999).
The most striking results in the second chapter of this thesis are that, indeed, there’s a
complex interplay between habitat structure and age (holm oaks are very distant so each tree
act as a discrete habitat patch), with greater species abundance, richness and diversity of
folivore Lepidoptera in old, larger and more connected trees than in young, small, isolated
ones. Thus, we detect colonization credits (i.e. time-lags between the emergence of suitable
habitat and the arrival of the organisms; Jackson & Sax 2010) in the youngest and most
isolated trees, probably due to dispersal limitations of the smallest species within the
Lepidoptera community. Heiniger et al. (2014), in one of the few studies available that tackles
the spatiotemporal structure of habitats altogether, demonstrated the key role of habitat
temporal structure for a Collembola community, revealing colonization credits in recent
habitats, especially forests, in line with the results of our findings. On the contrary, insect
species composition (alpha and beta diversity) found in each tree of the study site was
independent of the age and/or structure of the tree, but merely a function of the spatial
distance among trees, revealing a predominant random effect. Again, this result agrees with
Ricketts et al. (2001) who, addressing the assembly of a Lepidoptera community in tropical
forests, found that species composition changed exclusively as a function of distance between
habitat patches and not due to differences in habitat quality. In general, results showed that in
this archipelago of scattered trees the paradigm of island biogeography (MacArthur & Wilson,
1967) and neutral models (Gyllenberg & Hanski 1997; Hanski 1999) operate, as the community
is constrained to some extent by habitat spatiotemporal attributes and spatial dispersal ability
of Lepidoptera species. Similarly, in afforested areas with higher densities where Q. ilex trees
are colonizing new forests patches (Chapter 4), the interplay of herbivore dispersal ability and

Chapter 6: General discussion
106
landscape age and structure shapes the seed-predator guild formed by the tortrycid Cydia
fagiglandana and the two sibling species Curculio glandium and C. elephas. Moreover, C.
elephas exhibits colonization credits (sensu Jackson & Sax 2010) in the new and most isolated
forest patches probably due to the low dispersal ability of this species. Thus, local herbivore
community (both folivore and seed-predator) changes as a function of species’ dispersal ability
and habitat spatiotemporal attributes, and so different assemblages coexist at the regional
level in patchy and heterogeneous landscapes, increasing community heterogeneity.
6.2 Fatal attraction: The role of host genetic identity, ontogeny and spatial distribution in
insect herbivory in expanding oak forests
Simultaneously to the assembly of new herbivore communities in these new Mediterranean
forests, the arriving insects will start interacting with the plants that form their habitat
template and source of food and shelter (Bonal & Muñoz 2008; Valencia-Cuevas & Tovar-
Sánchez 2015). In Chapter 4, again, we find that individual characteristics of Q. ilex trees such
as identity, age, conspecific connectivity and location, create uneven patterns of herbivory
within the same patch. Even though these tree characteristics have been largely suggested to
have an impact on herbivory (McCrea & Abrahamson 1987; Urbas et al. 2007; Elger et al.
2009), little is known about the nature of the interactions among these factors. Within the new
patches of mixed Mediterranean forests studied in this chapter, we proved that genetic
identity and location of the tree, have direct effects on herbivory, with some tree clones being
more heavily attacked by herbivores than others as well as holm oaks at the patch core
compared to those located at the edge. These results agree with previous studies pointing out
genetic-based differences in chemical defenses as a main driver of herbivory exerted by
Lepidoptera (Hemming & Lindroth 1995; Osier et al. 2000). Even though a recent work of Solla
et al. 2016 have reported no effect of foliar tannin content of Q.ilex on larvae performance,
differences in other secondary metabolites could be behind leaf damage differences among
holm oak clones in our study site. The lower herbivory rates at the edge of the patch, supports
the hypothesis of leaf quality variations associated to differences in environmental conditions
between the edge and the core of the habitat, regulating herbivory by insects (Angulo-
Sandoval & Aide 2000; Rinker & Lowman 2004; Guirado et al. 2006). There are both,
supporting and contradictory literature for this better regulation of herbivores on forest edges
(McGeoch & Gaston 2000; Skoczylas et al. 2007; Wirth et al. 2008) and so further research
should be carried out on this topic.

Chapter 6: General discussion
107
In spite of the potential differences in apparency (Castagneyrol et al., 2013; Régolini et al.,
2014) and leaf quality (Bryant et al. 1992; Herms & Mattson 1992; Boege 2005) among
developmental stages (from seedlings to mature trees), no significant changes in leaf damage
were evidenced, challenging both, the plant-age hypothesis and the growth-differentiation
balance hypothesis (Barton & Koricheva, 2010). There is a lack of information on ontogenic
variation of chemical defenses on Q. ilex leaves and therefore, only a future study on the
metabolomics of foliar tissue could generate conclusive results on this regard. Herbivory in
new Mediterranean forests also seemed regulated by the interaction between tree age and
intra-patch connectivity with mature holm oaks, resulting in associational resistance (Hambäck
et al., 2000) against herbivores for trees but not for younger stages (seedling and saplings).
This pattern could be the result of short-distance plant-plant communication among
individuals that have already overcome the growth vs. defense trade-off (Herms & Mattson,
1992) mediated by the release of volatile signals, as already proved for Q. ilex in the face of
herbivory damage (Staudt & Lhoutellier, 2007). Unfortunately, little research has been
conducted in genetic-based traits and spatial location, and there is also a gap knowledge on
the effects of associational resistance on the behavior and survival of herbivores and their
natural enemies.
6.3 Different actors, same film: Shifts in the composition of the granivore guild has zero-sum
landscape effects on acorn predation in expanding Quercus ilex forests
Even though the herbivore-plant interaction takes place at the tree (individual) scale, its
dynamics will depend on processes operating at larger spatial scales, like the interplay
between species’ traits and spatiotemporal landscape attributes modulating community and
metacommunity dynamics at the local and regional scales, as observed in the Vallès forests
(Chapter 4). At a tree scale, we found higher infestation rates by C. fagiglandana in oaks
producing small crops made up by large seeds, as well as higher infestation rates by weevils in
connected oaks with large seeds, and so granivore and granivory assembly showed an
heterogeneous pattern in host with different characteristics (Chapter 4) just as the
Lepidoptera herbivore community and herbivory damage did (Chapters 2 and 3). Interestingly,
at the patch scale, the colonization credits shown by the poorest disperser of the seed-
predator guild, C. elephas, did not translate into a ‘predator release’ effect of holm oak crops
in new isolated forests, that is, the interaction intensity (acorn infestation rate) did not
decrease as a consequence of C. elephas lower abundance. We found an explanation for this

Chapter 6: General discussion
108
lack of ‘predator release’ effect in the even distributions of the good disperser C. fagiglandana
and C. glandium, which counterbalanced total abundances of species within the guild. Previous
work pointed out that this kind of compensatory dynamics are rare in natural ecological
communities (Houlahan et al., 2007) and that species tend to covary positively rather than
negatively. In spite of that, the homogeneity found in the granivore-oak interaction agrees
with the zero-sum assumption of Hubbell’s Neutral Theory of Biodiversity, in which the
changes in the abundance of one species are accompanied by compensatory changes in the
abundances of others due to resource constraints (Hubbell, 2001). If this negative covariance is
driven by interspecific competition among seed-predators, then the community would be at or
near its carrying capacity. Nonetheless, almost 80% of acorns remained non-attacked by
neither the acorn moth nor weevils and so most probably, resource limitation is not the key or
the unique driver of the zero-sum dynamics observed in this guild, but differences in dispersal
ability between species, as has been demonstrated for other study systems (Hagen et al.,
2012).
Similarly, even though a predator identity effect was found on the survival likelihood of acorn
embryo, with Curculio species destroying the embryo more often than C. fagiglandana, this
potential advantage in new isolated patches would vanish due to the even distribution of C.
glandium. Muñoz et al. (2014) already demonstrated that due to differences in larval size
among weevil species (Espelta et al. 2009; Pélisson et al. 2011), they had different nutritional
requirements and so the larval development of the largest bodied C. elephas was usually
constrained by cotyledon depletion. This difference in the amount of cotyledons consumed
linked to larval body size could also extend between weevils and the acorn moth. Supporting
this idea, Curculio females avoid ovopositing in acorns already occupied by moths (Debouzie et
al., 1996), while the opposite avoidance behavior has not been described for C. fagiglandana,
whose smaller larvae could have lower nutritional requirements. In addition, differences in
ethology (of both adults and larvae) could be important since weevil larvae are constrained to
develop within a single acorn, while acorn moth larvae are able to switch from one acorn to
another (Soria, 1999). Even though at the patch scale this “seed-predator identity” effect
vanishes due to the zero-sum dynamics in the forests studied in this thesis, this finding
underscores the importance that for the estimation of crop size available for plant
recruitment, might have to consider the identity of the predator species and not only the
number of acorns infested, since differences in seed survival have been revealed for other
study systems when predators of different sizes are removed (e.g. see Hautier et al. 2010 for

Chapter 6: General discussion
109
vertebrate herbivores). In agreement with the dynamics arisen at patch level, connected
landscape hosted higher abundances of C. elephas, while herbivory was equally spread.
6.4 What lies beneath: Have dispersal vs. dormancy strategies of tracking unpredictable
resources already left a genetic signature on Curculio populations inhabiting expanding
Quercus ilex forests?
To sum up, Chapters 2, 3 and 4, support the importance of tackling the community and
interaction assembly from interactive approaches and several spatial scales, since complex
interplays can be missed and their relative importance on herbivore community and herbivore
assembly, largely depends on the scale chosen. While there are some studies on
spatiotemporal landscape attributes and species’ traits impact on community assembly
(Borges & Brown 1999; Tscharntke & Brandl 2004; Badano et al. 2005; Jackson & Sax 2010),
much less is known about the genetic diversity and isolation of these emerging communities.
Weevils have evolved dispersal strategies in time and space to cope with unpredictable acorn
availability (Venner et al. 2011; Pélisson et al. 2012; Pélisson et al. 2013). Chapter 4 revealed
that in new forests of the Iberian Peninsula, these differences in extinction risk spreading
strategies have impacted community composition. As seen in Chapter 5, nevertheless, it seems
to be only partially responsible for the genetic structure and variability observed in the same
populations. In accordance with the colonization credits exhibited by C. elephas in new
isolated forests in Chapter 4, this poor disperser showed a significant genetic structure among
populations as well as restricted gene flow between old forests and new isolated ones in
Chapter 5; on the contrary, C. glandium populations showed no genetic structure and no
restrictions to gene flow. This results agree with the maximum 600-m dispersal ability
estimated for C. elephas (Pélisson et al., 2013), which would experience this forest mosaic as
patchy, while C. glandium, with an estimated 1200-m dispersal ability, would experience the
same mosaic as a continuous habitat. Thus, dispersal limitation lowers genetic diversity of C.
elephas populations in new isolated forests, while C. glandium recurrently colonizes new
forests, even the most isolated ones, counterbalancing the potential loss of genetic variability
due to bottlenecks associated to local environmental stochasticity.
This high genetic diversity in colonizing populations has been studied with special attention in
the case of aquatic invaders, whose populations have increased their genetic diversity as a
function of the size and frequency of human-assisted inoculations (Dupont et al. 2003; Voisin
et al. 2005; Simon-Bouhet et al. 2006). In a similar way, recurrent colonization events would
Chapter 6: General discussion
110
have increased the probability of establishment of C. glandium populations, vanishing the
founder effect. On the contrary, large populations of C. elephas are poor in genetic variability,
suggesting that this species experience quick population growths after both, bottlenecks and
founder effects, in all forest types. We find strong support in the literature of fecundity
benefits in large-bodied insects being behind this pattern of large populations with unexpected
poor genetic variability. Body size is a key life-history trait in insects that is strongly related to
individual fitness, and particularly in C. elephas larval size is correlated with adult size (Bonal et
al., 2011) and larger females lay more eggs (Desouhant et al., 2000). Since previous work in
related species of butterflies have shown that larger sized species have a higher potential
fecundity (García-Barros, 2000), this could be also true between the small-bodied C. glandium
and the larger-bodied C. elephas. The limitation in dispersal ability of C. elephas is paying its
toll on population genetic diversity and even though large numbers guarantee the persistence
of these populations in the short-term, the future resilience of this species in Mediterranean
forests in expansion could be threaten due to the inherent environmental stochasticity of this
habitats (Lionello et al., 2006) and the forecast scenario of drier summers in Mediterranean
areas (Bonal et al., 2015).
6.5 Perspectives
Undoubtedly, this thesis leaves still some uncertainties about the underlying mechanisms and
drivers of herbivore community assembly and herbivory assembly in new forests. The
complexity of this topic, as well as the idiosyncrasy of study systems represent a challenge for
attempts to identify key determinants and extract generalizable principles. From a practical
point of view, this thesis provides valuable information for the management of herbivore
impact on the expanding populations of Q. ilex, a key species of Mediterranean forests (Blanco
1998; Faivre-Rampant et al. 2011). Studies to date show no consistent response of herbivore
insects to habitat fragmentation (McGeoch & Gaston 2000; Skoczylas et al. 2007; De Carvalho
Guimarães et al. 2014; Maguire et al. 2016), however, evidences from Huecas and Vallès
lowlands suggest that the patchy arrangement of these expanding habitats are favoring the
existence of different herbivore assemblages, but with a resultant zero-sum impact of
herbivory on holm oaks. Therefore, the maintenance of this patchy arrangement with
moderate isolation among patches, could be a strategy to keep higher beta diversity within the
regional herbivore community at the landscape level, without disrupting metacommunity
functioning (Jamoneau et al., 2012). On the other hand, favoring connectivity by the

Chapter 6: General discussion
111
maintenance of isolated holm oaks that could act as stepping stones for C. elephas dispersers
would lessen the extinction risk of its populations in isolated patches (Manning et al., 2006).
Regarding holm oak recruitment, small patches with large edge/core ratio can facilitate holm
oak expansion due to the better regulation of herbivory at edges, as well as mixed patches
with numerous holm oak clones and different woody species that could prevent the quick
herbivore spillover among trees of the same origin (Dulaurent et al., 2012).
Worth studying in the future would be the management of isolated canopies in savannah-like
landscapes, since better structured and encroached canopies host more abundant, richer and
diverse Lepidoptera communities, could we enhance the establishment of these insect species
by encouraging the production of new shoots and encroachment of holm oak canopies by
means of pruning? Also, future research in areas with a more contrasting landscape
connectivity, in which the effects of habitat age and habitat connectivity could be clearly tease
apart, would be the next step on the study of community and interaction assembly in these
expanding Mediterranean forests. Furthermore, we could study whether there exist a
connectivity threshold below which, fitness advantage shown by C. elephas compared to C.
glandium, could no longer counteract the negative effects of bottlenecks. Should exist such a
threshold, new and highly isolated patches would experience a ‘predator release’ and holm
oaks could pay their colonization credits quicker. Management strategies will vary depending
on which ecological process we want to enhance, whether is the expansion of the key species
Quercus ilex, or the promotion of biotic interactions that would reinforce the resilience of the
ecosystem.
6.6 CONCLUSIONS
From the results obtained in this thesis, we can deduce the following general conclusions:
1. There exist complex interactions between holm oak canopy size, connectivity and age
which, in combination with species’ dispersal ability, have an impact on the
abundance, richness and diversity of the Lepidoptera herbivore community colonizing
holm oak trees in a recently created savannah-like landscape (Chapter 2).
2. Random effects mediated by the spatial distance between these holm oaks, are also
shaping alpha and beta diversity patterns in the Lepidoptera community (Chapter 2).

Chapter 6: General discussion
112
3. At the local scale, individual host-characteristics such as genetic origin and location
within the patch, have a direct impact on herbivory pressure, causing uneven leaf
damage among different clones and an edge effect (Chapter 3).
4. On the contrary, age of the holm oak and connectivity with conspecifics, interact to
affect herbivory pressure by associational resistance of trees in the vicinity of the
oldest holm oaks (Chapter 3).
5. At the regional scale, dispersal ability plays a very important role in the community
assembly of granivore insects, causing colonization credits in the poor disperser C.
elephas in new and isolated forest patches, as well as unrestricted distributions of the
good disperser C. glandium and C. fagiglandana (Chapter 4).
6. This compensatory dynamics in abundances vanishes the potential ‘predator release’
derived from C. elephas colonization credit. Consequently, the presence of patches
with different age and connectivity promotes heterogeneity in seed-predator
assemblages but homogenization of granivory at the regional scale, leading to zero-
sum effects on acorn-predation intensity (Chapter 4).
7. The interplay of insect dispersal ability with habitat age and connectivity within the
mosaic forest affect the herbivore community in terms of relative abundances but also
at the finer genetic level (Chapter 5).
8. Limited dispersal causes restrictions in gene flow and a decrease in genetic diversity in
C. elephas populations inhabiting new isolated patches, which exhibits bottleneck and
founder effects, while no effects were observed in C. glandium (Chapter 5).
9. In spite of bottlenecks and founder effects in C. elephas, its populations are larger than
C. glandium ones in all forest types, so other factors are certainly favoring the fitness
of the former one (Chapter 5).

113
References
Albrecht, M., Duelli, P., Schmid, B., & Müller, C.B. (2007) Interaction diversity within quantified insect food webs in restored and adjacent intensively managed meadows. Journal of
Animal Ecology, 76, 1015–1025.
Amarasekare, P. (2003) Competitive coexistence in spatially structured environments: A synthesis. Ecology Letters, 6, 1109–1122.
Amarasekare, P. (2013) COEXISTENCE OF COMPETING PARASITOIDS ON A PATCHILY DISTRIBUTED HOST: LOCAL VS. SPATIAL MECHANISMS. Ecology, 81, 1286–1296.
Andrén, H. (1994) Effects of Habitat Fragmentation on Birds and Mammals in Landscapes with Different Proportions of Suitable Habitat: A Review. Oikos, 71, 355–366.
Angelini, C., Altieri, A.H., Silliman, B.R., & Bertness, M.D. (2011) Interactions among Foundation Species and Their Consequences for Community Organization, Biodiversity, and Conservation. BioScience, 61, 782–789.
Angulo-Sandoval, P. & Aide, T.M. (2000) Effect of plant density and light availability on leaf damage in Manilkara bidentata (Sapotaceae). Journal of Tropical Ecology, 16, 447–464.
Antao, T., Lopes, A., Lopes, R.J., Beja-Pereira, A., & Luikart, G. (2008) LOSITAN: A workbench to detect molecular adaptation based on a Fst-outlier method. BMC Bioinformatics, 9, 1–5.
Arias-LeClaire, H., Bonal, R., García-López, D., & Espelta, J.M. (2017) The role of seed size, phenology, oogenesis and host distribution in the specificity and genetic structure in seed weevils (Curculio spp .) in mixed forests. Integrative Zoology, .
Attocchi, G. (2013) Effects of pruning and stand density on the production of new epicormic shoots in young stands of pedunculate oak (Quercus robur L.). ANNALS OF FOREST
SCIENCE, 70, 663–673.
Awmack, C.S. & Leather, S.R. (2002) Host plant quality and fecundity in herbivorous insects. Annual Review of Entomology, 47, 817–844.
Badano, E.I., Regidor, H.A., Núñez, H.A., Acosta, R., & Gianoli, E. (2005) Species richness and structure of ant communities in a dynamic archipelago: Effects of island area and age. Journal of Biogeography, 32, 221–227.
Bagaria, G., Helm, A., Rodà, F., & Pino, J. (2015) Assessing coexisting plant extinction debt and colonization credit in a grassland–forest change gradient. Oecologia, 179, 823–834.
Baguette, M., Mennechez, G., Petit, S., & Schtickzelle, N. (2003) Effect of habitat fragmentation on dispersal in the butterfly Proclossiana eunomia. Comptes Rendus-Biologies, 326, 200–209.
Bailey, N.W., Garcia, C.M., & Ritchie, N.M. (2007) Beyond the point of no return? A comparison of genetic diversity in captive and wild populations of two nearly extinct species of Goodeid fish reveals that one is inbred in the wild. Heredity, 98, 360–367.
Baraza, E., Gomez, J., Hodar, J., & Zamora, R. (2004) Herbivory has a greater impact in shade than in sun: response of Quercus pyrenaica seedlings to multifactorial environmental variation. Canadian Journal of Botany, 82, 357–364.
Barber, N.A. & Marquis, R.J. (2011) Light environment and the impacts of foliage quality on

114
herbivorous insect attack and bird predation. Oecologia, 166, 401–409.
Barbosa, P., Hines, J., Kaplan, I., Martinson, H., Szczepaniec, A., & Szendrei, Z. (2009) Associational Resistance and Associational Susceptibility: Having Right or Wrong Neighbors. Annual Review of Ecology, Evolution, and Systematics, 40, 1–20.
Barbour, M.A., Rodriguez-Cabal, M.A., Wu, E.T., Julkunen-Tiitto, R., Ritland, C.E., Miscampbell, A.E., Jules, E.S., & Crutsinger, G.M. (2015) Multiple plant traits shape the genetic basis of herbivore community assembly. Functional Ecology, 29, 995–1006.
Barrett, R.D.H. & Agrawal, A.A. (2004) Interactive effects of genotype, environment, and ontogeny on resistance of cucumber (Cucumis sativus) to the generalist herbivore, Spodoptera exigua. Journal of Chemical Ecology, 30, 37–51.
Barton, K.E., E.Valkama, Vehviläinen, H., Ruohomäki, K., Knight, T.M., & Koricheva, J. (2015) Additive and non-additive effects of birch genotypic diversity on arthropod herbivory in a long-term field experiment. Oikos, 124, 697–706.
Barton, K.E. & Hanley, M.E. (2013) Seedling-herbivore interactions: insights into plant defence and regeneration patterns. Annals of Botany, 112, 643–65.
Barton, K.E. & Koricheva, J. (2010) The Ontogeny of Plant Defense and Herbivory: Characterizing General Patterns Using Meta-Analysis. The American Naturalist, 175, 481–493.
Baśnou, C., Álvarez, E., Bagaria, G., Guardiola, M., Isern, R., Vicente, P., & Pino, J. (2013) Spatial patterns of land use changes across a mediterranean metropolitan landscape: Implications for biodiversity management. Environmental Management, 52, 971–980.
Basnou, C. & Pino, J. (2015) Examining the role of landscape structure and dynamics in alien plant invasion from urban Mediterranean coastal habitats invasion from urban Mediterranean coastal habitats. Landscape and Urban Planning, 136, 156–164.
Basnou, C., Vicente, P., Espelta, J.M., & Pino, J. (2016) Of niche differentiation, dispersal ability and historical legacies: what drives woody community assembly in recent Mediterranean forests? Oikos, 125, 107–116.
Basset, Y. (2001) Communities of insect herbivores foraging on saplings versus mature trees of Pourouma bicolor (Cecropiaceae) in Panama. Oecologia, 129, 253–260.
Beaumont, M.A. & Nichols, R.A. (1996) Evaluating loci for use in the genetic analysis of population structure. Proceedings of the Royal Society of London B, 263, 1619–1626.
Beckman, N.G., Neuhauser, C., & Muller-Landau, H.C. (2012) The interacting effects of clumped seed dispersal and distance- and density-dependent mortality on seedling recruitment patterns. Journal of Ecology, 100, 862–873.
Bell, G. (2001) Ecology—neutral macroecology. Science, 293, 2413–2418.
Bellmann, H. (2017) Guía de las mariposas de Europa.
Bello-Bedoy, R. & Núñez-Farfán, J. (2011) The effect of inbreeding on defence against multiple enemies in Datura stramonium. Journal of Evolutionary Biology, 24, 518–530.
Benitez-Malvido, J., García-Guzmán, G., & Kossmann-Ferraz, I.D. (1999) Leaf-fungal incidence and herbivory on tree seedlings in tropical rainforest fragments: an experimental study. Biological Conservation, 91, 143–150.
Berger, D., Walters, R., & Gotthard, K. (2008) What limits insect fecundity? Body size- and
115
temperature-dependent egg maturation and oviposition in a butterfly. Functional
Ecology, 22, 523–529.
Blanco, E. (1998) Los bosques españoles. Lunberg, Barcelona.
Blanco, E., Casado, M.A., Costa, M., Escribano, R., García, M., Génova, M., & ... & Regato, P. (1997) Los Bosques Ibéricos . Una Interpretación Geobotánica. Planeta, Madrid, Spain.
Boege, K. (2005) Herbivore attack in Casearia nitida influenced by plant ontogenetic variation in foliage quality and plant architecture. Oecologia, 143, 117–125.
Boege, K. & Marquis, R.J. (2005) Facing herbivory as you grow up: The ontogeny of resistance in plants. Trends in Ecology and Evolution, 20, 441–448.
Bogdziewicz, M., Espelta, J.M., Muñoz, A., Aparicio, J.M., & Bonal, R. (2018) Effectiveness of predator satiation in masting oaks is negatively affected by conspecific density. Oecologia, 186, 1–11.
Bolliger, J., Kienast, F., Soliva, R., & Rutherford, G. (2007) Spatial sensitivity of species habitat patterns to scenarios of land use change (Switzerland). Landscape Ecology, 22, 773–789.
Bonal, R., Espelta, J.M., & Vogler, A.P. (2011) Complex selection on life-history traits and the maintenance of variation in exaggerated rostrum length in acorn weevils. Oecologia, 167, 1053–61.
Bonal, R., Hernandez, M., Espelta, J.M., Munoz, A., & Aparicio, J.M. (2015) Unexpected consequences of a drier world: evidence that delay in late summer rains biases the population sex ratio of an insect. Royal Society open science, 2, 150198.
Bonal, R., Hernández, M., Ortego, J., Muñoz, A., & Espelta, J.M. (2012) Positive cascade effects of forest fragmentation on acorn weevils mediated by seed size enlargement. Insect
Conservation and Diversity, 5, 381–388.
Bonal, R. & Muñoz, A. (2008) Seed growth suppression constrains the growth of seed parasites: premature acorn abscission reduces Curculio elephas larval size. Ecological
Entomology, 33, 31–36.
Bonal, R. & Muñoz, A. (2009) Seed weevils living on the edge: Pressures and conflicts over body size in the endoparasitic Curculio larvae. Ecological Entomology, 34, 304–309.
Bonal, R., Muñoz, A., & Díaz, M. (2007) Satiation of predispersal seed predators: the importance of considering both plant and seed levels. Evolutionary Ecology, 21, 367–380.
Bonal, R., Muñoz, A., & Espelta, J.M. (2010) Mismatch between the timing of oviposition and the seasonal optimum. The stochastic phenology of Mediterranean acorn weevils. Ecological Entomology, 35, 270–278.
Borges, P. a. & Brown, V.K. (1999) Effect of island geological age on the arthropod species richness of Azorean pastures. Biological Journal of the Linnean Society, 66, 373.
Bossema, I. (1979) Jays and oaks: an eco-ethological study of a symbiosis. Behaviour, 70, 1–117.
Bouget, C., Brin, A., Tellez, D., & Archaux, F. (2015) Intraspecific variations in dispersal ability of saproxylic beetles in fragmented forest patches. Oecologia, 177, 911–920.
Brückmann, S. V., Krauss, J., & Steffan-Dewenter, I. (2010) Butterfly and plant specialists suffer from reduced connectivity in fragmented landscapes. Journal of Applied Ecology, 47, 799–809.

116
Brudvig, L.A., Damschen, E.I., Haddad, N.M., Levey, D.J., & Tewksbury, J.J. (2015) The influence of habitat fragmentation on multiple plant-animal interactions and plant reproduction. Ecology, 96, 2669–2678.
Bryant, J.P., Reichardt, P.B., Clausen, T.P., Provenza, F.D., & Kuropat, P.J. (1992) Woody plant-mammal interactions. Herbivores: their interactions with secondary plant metabolites, vol
II (ed. by G.A. Rosenthal and M.R. Berenbaum), pp. 343–371. Academic Press, San Diego, USA.
De Carvalho Guimarães, C.D., Viana, J.P.R., & Cornelissen, T. (2014) A Meta-Analysis of the Effects of Fragmentation on Herbivorous Insects. Environmental Entomology, 43, 537–545.
Castagneyrol, B., Giffard, B., Péré, C., & Jactel, H. (2013) Plant apparency, an overlooked driver of associational resistance to insect herbivory. Journal of Ecology, 101, 418–429.
Castagneyrol, B., Lagache, L., Giffard, B., Kremer, A., & Jactel, H. (2012) Genetic diversity increases insect herbivory on oak saplings. PLoS ONE, 7, e44247.
Cervera, T., Garrabou, R., & Tello, E. (2015) Política forestal y evolución de los bosques en Cataluña desde el siglo xix hasta la actualidad. Investigaciones de Historia Economica, 11, 116–127.
Chancerel, E., Lamy, J.-B., Lesur, I., Noirot, C., Klopp, C., Ehrenmann, F., Boury, C., Le Provost, G., Label, P., Lalanne, C., Léger, V., Salin, F., Gion, J.-M., & Plomion, C. (2013) High-density linkage mapping in a pine tree reveals a genomic region associated with inbreeding depression and provides clues to the extent and distribution of meiotic recombination. BMC Biology, 11, 50.
Chase, J.M. & Leibold, M.A. (2003) Ecological Niches: Linking Classical and Contemporary
Approaches. University of Chicago Press, Chicago, USA.
Chave, J. & Leigh, E.G. (2002) A spatially explicit neutral model of betadiversity in tropical forests. Theoretical Population Biology, 62, 153–168.
Chen, Y.H., Opp, S.B., Berlocher, S.H., & Roderick, G.K. (2006) Are bottlenecks associated with colonization? Genetic diversity and diapause variation of native and introduced Rhagoletis completa populations. Handbook of Environmental Chemistry, Volume 5:
Water Pollution, 149, 656–667.
Chesson, P. (2000) Mechanisms of maintenance of species diversity. Annual Review of Ecology
and Systematics, 31, 343–366.
Coley, P.D. & Barone, J.A. (1996) HERBIVORY AND PLANT DEFENSES IN TROPICAL FORESTS. Annual Review of Ecology and Systematics, 27, 305–335.
Colwell, R.K. (2009) Biodiversity: Concepts, Patterns, and Measurement. Princeton Guide to
Ecology (ed. by S.A. Levin, S.R.H. Carpenter, C.J. Godfray, A.P. Kinzig, M. Loreau, J.B. Losos, B. Walker, and D.S. Wilcove), pp. 257. Princeton University Press, New Jersey, USA.
Cottenie, K. (2005) Integrating environmental and spatial processes in ecological community dynamics. Ecology Letters, 8, 1175–1182.
Coutin, R. (1960) Estimation de l’importance des populations d’imagos de Balaninus elephas Gyll dans une châtaigneraie ce’venole. Rev Zool Agr Appl, 59, 1–5.
Crawley, M.J. & Long, C.R. (2008) Alternate Bearing , Predator Satiation and Seedling Recruitment in Quercus Robur L. Journal of Ecology, 83, 683–696.

117
Cristofoli, S. & Mahy, G. (2010) Colonisation credit in recent wet heathland butterfly communities. Insect Conservation and Diversity, 3, 83–91.
Debouzie, D., Heizmann, A., Desouhant, E., & Menu, F. (1996a) Interference at several temporal and spatial scales between two chestnut insects. Oecologia, 108, 151–158.
Debouzie, D., Heizmann, A., Desouhant, E., & Menu, F. (1996b) Interference at several temporal and spatial scales between two chestnuts insects. Oecologia, 108, 151–158.
Del-Val, E. & Dirzo, R. (2003) Does ontogeny cause changes in the defensive strategies of the myrmecophyte Cecropia peltata? Plant Ecology, 169, 35–41.
DeSoto, L., Olano, J.M., Rozas, V., & Cruz, M. (2010) Release of Juniperus thurifera woodlands from herbivore-mediated arrested succession in Spain. Applied Vegetation Science, 13, 15–25.
Desouhant, E., Debouzie, D., Ploye, H., & Menu, F. (2000a) Clutch size manipulations in the chestnutweevil, Curculio elephas: fitness of oviposition strategies. Oecologia, 122, 493–499.
Desouhant, E., Debouzie, D., Ploye, H., & Menu, F. (2000b) Clutch size manipulations in the chestnut weevil, Curculio elephas: fitness of oviposition strategies. Oecologia, 122, 493–499.
Didham, R.K., Kapos, V., & Ewers, R.M. (2012) Rethinking the conceptual foundations of habitat fragmentation research. Oikos, 121, 161–170.
Doak, P. (2000) Population consequences of restricted dispersal for an insect herbivore in a subdivided habitat. Ecology, 81, 1828–1841.
Dolch, R. & Tscharntke, T. (2000) Defoliation of alders (Alnus glutinosa) affects herbivory by leaf beetles on undamaged neighbors. Oecologia, 125, 504–11.
Doligez, B. & Part, T. (2008) Estimating fitness consequences of dispersal: a road to “know-where”? Non-random dispersal and the underestimation of dispersers’ fitness. Journal of
Animal Ecology, 77, 1199–1211.
Donaldson, J.R. & Lindroth, R.L. (2008) Effects of variable phytochemistry and budbreak phenology on defoliation of aspen during a forest tent caterpillar outbreak. Agricultural
and Forest Entomology, 10, 399–410.
Drake, D.R., Mulder, C.P.H., Towns, D.R., & Daugherty, C.H. (2002) The biology of insularity: An introduction. Journal of Biogeography, 29, 563–569.
Dudt, J.F. & Shure, D.J. (1994) The influence of light and nutrients on foliar phenolics and insect herbivory. Ecology, 75, 86–98.
Dulaurent, A.M., Porté, A.J., van Halder, I., Vétillard, F., Menassieu, P., & Jactel, H. (2012) Hide and seek in forests: Colonization by the pine processionary moth is impeded by the presence of nonhost trees. Agricultural and Forest Entomology, 14, 19–27.
Duminil, J., Fineschi, S., Hampe, A., Jordano, P., Salvini, D., Vendramin, G.G., & Petit, R.J. (2007) Can Population Genetic Structure Be Predicted from Life-History Traits? The american
naturalist, 169, 662–672.
Dupanloup, I., Schneider, S., & Excoffier, L. (2002) A simulated annealing approach to define the genetic structure of populations. Molecular Ecology, 11, 2571–2581.
Dupont, L., Jollivet, D., & Viard, F. (2003) High genetic diversity and ephemeral drift effects in a
118
recent and successful introduced mollusc (Crepidula fornicata: Gastropoda). Marine
Ecology Progress Series, 253, 183–195.
Elger, A., Lemoine, D.G., Fenner, M., & Hanley, E., M. (2009) Plant ontogeny and chemical defence: older seedlings are better defended. Oikos, 118, 767–773.
Ellstrand, N.C. & Elam, D.R. (1993) Population genetic consequences of small population size: implications for plant conservation. Annual Review of Ecology and Systematicsatics, 24, 217–243.
Ernest, S.K.M., Brown, J.H., Thibault, K.M., White, E.P., & Goheen, J.R. (2008) Zero Sum, the Niche, and Metacommunities: Long-Term Dynamics of Community Assembly. The
American Naturalist, 172, E257–E269.
Ernest, S.K.M., White, E.P., & Brown, J.H. (2009) Changes in a tropical forest support metabolic zero-sum dynamics. Ecology Letters, 12, 507–515.
Espelta, J.M., Arias-Leclaire, H., Fernandez-Martinez, M., Doblas-Miranda, E., Muñoz, A., & Bonal, R. (2017) Beyond predator satiation: Masting but also the effects of rainfall stochasticity on weevils drive acorn predation. Ecosphere, 8, .
Espelta, J.M., Bonal, R., & Sánchez-Humanes, B. (2009a) Pre-dispersal acorn predation in mixed oak forests: interspecific differences are driven by the interplay among seed phenology, seed size and predator size. Journal of Ecology, 97, 1416–1423.
Espelta, J.M., Cortés, P., Molowny-Horas, R., & Retana, J. (2009b) Acorn crop size and pre-dispersal predation determine inter-specific differences in the recruitment of co-occurring oaks. Oecologia, 161, 559–68.
Espelta, J.M., Cortés, P., Molowny-Horas, R., Sánchez-Humanes, B., & Retana, J. (2008) MASTING MEDIATED BY SUMMER DROUGHT REDUCES ACORN PREDATION. Ecology, 89, 805–817.
Espelta, J.M., Riba, M., & Retana, J. (1995) Patterns of seedling recruitment in West-Mediterranean Quercus ilex forests influenced by canopy development. Journal of
Vegetation Science, 6, 465 – 472.
Etienne, R.S., Alonso, D., & Mckane, A.J. (2007) The zero-sum assumption in neutral biodiversity theory. Journal of Theoretical Biology, 248, 522–536.
Ettema, E.H. & Wardle, D.A. (2002) Spatial soil ecology. Trends in Ecology and Evolution, 17, 177–183.
Evans, E.W., Bolshakova, V.L.J., & Carlile, N.R. (2015) Parasitoid dispersal and colonization lag in disturbed habitats: Biological control of cereal leaf beetle metapopulations. Journal of
Applied Entomology, 139, 529–538.
Excoffier, L., Laval, G., & Schneider, S. (2005) Arlequin ver. 3.0: An integrated software package for population genetics data analysis. Evolutionary Bioinformatics Online, 1, 47–50.
Faeth, S.H. & Bultman, T.L. (1986) Interacting effects of increased tannin levels on leaf-mining insects. Entomologia Experimentalis et Applicata, 40, 297–301.
Faivre-Rampant, P., Lesur, I., Boussardon, C., Bitton, F., Martin-Magniette, M.L., Bodénès, C., Le Provost, G., Bergès, H., Fluch, S., Kremer, A., & Plomion, C. (2011) Analysis of BAC end sequences in oak, a keystone forest tree species, providing insight into the composition of its genome. BMC Genomics, 12, 292.
119
Feeny, P. (1970) Seasonal Changes in Oak Leaf Tannins and Nutrients as a Cause of Spring Feeding by Winter Moth Caterpillars. Ecology, 51, 565–581.
Fenner, M., Hanley, M.E., & Lawrence, R. (1999) Comparison of seedling and adult palatability in annual and perennial plants. Functional Ecology, 13, 546–551.
Fernandez-Conradi, P., Jactel, H., Hampe, A., Leiva, M.J., & Castagneyrol, B. (2017) The effect of tree genetic diversity on insect herbivory varies with insect abundance. Ecosphere, 8, .
Fernández, J. & Jordano, D. (2004) Las mariposas del monte mediterráneo andaluz. El monte
mediterráneo en Andalucía (ed. by C.M. (coordinador. Herrera), pp. 62–119. Consejería de Medio Ambiente. Junta de Andalucía, Sevilla.
Fleishman, E., Ray, C., Sjögren-Gulve, P., Boggs, C.L., & Murphy, D.D. (2002) Assessing the roles of patch quality, area, and isolation in predicting metapopulation dynamics. Conservation
Biology, 16, 706–716.
Foley, J.A., DeFries, R., Asner, G.P., Barford, C., Bonan, G., Carpenter, S.R., Chapin, F.S., Coe, M.T., Daily, G.C., Gibbs, H.K., Helkowski, J.H., Holloway, T., Howard, E.A., Kucharik, C.J., Monfreda, C., Patz, J.A., Prentice, I.C., Ramankutty, N., & Snyder, P.K. (2005) Global consequences of land use. Science, 309, 570–574.
Fountain-Jones, N.M., Jordan, G.J., Baker, T., Balmer, J., & Baker, S.C. (2015) Living near the edge: Being close to mature forest increases the rate of succession in beetle communities. Ecological Applications, 25, 800–811.
Frankham, R. (2005) Genetics and extinction. Biological Conservation, 126, 131–140.
Frankham, R., Ballou, J.D., & Briscoe, D.A. (2002) Introduction to conservation genetics.
Cambridge University Press, Cambridge, UK.
Franklin, M.T., Myers, J.H., & Cory, J.S. (2014) Genetic similarity of island populations of tent caterpillars during successive outbreaks. PloS one, 9, e96679.
Frouz, J. & Kindlmann, P. (2015) Source-Sink Colonization as a Possible Strategy of Insects Living in Temporary Habitats. PloS one, 10, e0127743.
Fu, Y.X. (1997) Statistical tests of neutrality of mutations against population growth, hitchhiking and background selection. Genetics, 147, 915–925.
Fuchs, R., Herold, M., Verburg, P.H., & Clevers, J.G.P.W. (2013) A high-resolution and harmonized model approach for reconstructing and analysing historic land changes in Europe. Biogeosciences, 10, 1543–1559.
García-Barros, E. (2000) Fluctuating asymmetry in antlers of fallow deer (Dama dama): the relative roles of enviromental stress and sexual selection. Biological Journal of the
Linnean Society, 70, 251–284.
Gené, C., Espelta, J.M., Gràcia, M., & Retana, J. (1993) Identificación de los anillos anuales de crecimiento de la encina (Quercus ilex L.). Orsis: organismes i sistemes, 8, 127–139.
Gerber, S., Chadœuf, J., Gugerli, F., Lascoux, M., Buiteveld, J., Cottrell, J., Dounavi, A., Fineschi, S., Forrest, L.L., Fogelqvist, J., Goicoechea, P.G., Jensen, J.S., Salvini, D., Vendramin, G.G., & Kremer, A. (2014) High rates of gene flow by pollen and seed in oak populations across Europe. PloS one, 9, .
Gerzabek, G., Oddou-muratorio, S., & Hampe, A. (2017) Temporal change and determinants of maternal reproductive success in an expanding oak forest stand. Journal of Ecology, 105,

120
39–48.
Gilpin, M.E. & Diamond, J.M. (1976) Calculation of immigration and extinction curves from the species-area-distance relation. Proceedings of the National Academy of Sciences of the
United States of America, 73, 4130–4134.
Gómez de Aizpúrua, C. (2003) Orugas y mariposas de Europa. Organismo Autónomo Parques Nacionales, Madrid.
Goodger, J.Q.D., Gleadow, R.M., & Woodrow, I.E. (2006) Growth cost and ontogenetic expression patterns of defence in cyanogenic Eucalyptus spp. Trees, 20, 757–765.
Govindan, B.N. & Swihart, R.K. (2015) Community structure of acorn weevils ( Curculio ): inferences from multispecies occupancy models. Canadian Journal of Zoology, 93, 31–39.
Gracia, M., Retana, J., & Pico, F.X. (2001) Seedling bank dynamics in managed holm oak (Quercus ilex) forests. Annals of Forest Science, 58, 843– 852.
Gravel, D., Canham, C.D., Beaudet, M., & Messier, C. (2006) Reconciling niche and neutrality: the continuum hypothesis. Ecology Letters, 9, 399–409.
Gripenberg, S. & Roslin, T. (2005) Host plants as islands : Resource quality and spatial setting as determinants of insect distribution. Annales Zoologici Fennici, 42, 335–345.
Grove, A.T. & Rackman, O. (2001) The nature of Mediterranean Europe. Yale University Press, New Haven.
Guardiola, M., Pino, J., & Rodà, F. (2013) Patch history and spatial scale modulate local plant extinction and extinction debt in habitat patches. Diversity and Distributions, 19, 825–833.
Guardiola, M., Stefanescu, C., Rodà, F., & Pino, J. (2017) Do asynchronies in extinction debt affect the structure of trophic networks? A case study of antagonistic butterfly larvae–plant networks. Oikos, 0, .
Guirado, M., Pino, J., & Rodà, F. (2006) Understory plant species richness and composition in metropolitan forest archipelagos: Effects of forests size, adjacent land-use and distance to the edge. Global Ecology and Biogeography, 15, 50–62.
Guirado, M., Pino, J., Rodà, F., & Basnou, C. (2008) Quercus and Pinus cover are determined by landscape structure and dynamics in peri-urban Mediterranean forest patches. Plant
Ecology, 194, 109–119.
Guyot, V., Castagneyrol, B., Vialatte, A., Deconchat, M., & Jactel, H. (2016) Tree diversity reduces pest damage in mature forests across Europe. Biology Letters, 12, 20151037.
Gyllenberg, M. & Hanski, I. (1997) Habitat deterioration, habitat destruction, and metapopulation persistence in a heterogenous landscape. Theoretical Population Biology, 52, 198–215.
Haase, J., Castagneyrol, B., Cornelissen, J.H.C., Ghazoul, J., Kattge, J., Koricheva, J., Scherer-Lorenzen, M., Morath, S., & Jactel, H. (2015) Contrasting effects of tree diversity on young tree growth and resistance to insect herbivores across three biodiversity experiments. Oikos, 124, 1674–1685.
Hagen, M., Kissling, W.D., Rasmussen, C., et al. (2012) Biodiversity, Species Interactions and Ecological Networks in a Fragmented World. Advances in Ecological Research, 46, 89–120.

121
Haig, S.M. & Avise, J.C. (1996) Avian conservation genetics. Conservation genetics: case
histories from nature (ed. by J.C. Hamrick and J.L. Avise), pp. 160–189. Chapman and Hall, New York.
Hambäck, P.A., Agren, J., & Ericson, L. (2000) Associational resistance: insect damage to purple loosestrife reduced in thickets of sweet gale. Ecology, 81, 1784–1794.
Hammond, D.S. & Brown, V.K. (1998) Disturbance, phenology and life-history characteristics: factors influencing distance/density-dependent attack on trpocail seeds and seedlings. Dynamics of Tropical Communities (ed. by D.M. et al. Newbery), pp. 51–78. Blackwell Science,
Hanski, I. (1994) Patch-occupancy dynamics in fragmented landscapes. Trends in Ecology and
Evolution, 9, 131–135.
Hanski, I. (1999) Metapopulation ecology. Oxford University Press, Oxford.
Hastings, A. & Harrison, S. (1994) Metapopulation dynamics and genetics. Annual Review of
Ecology and Systematics, 25, 167–188.
Hautier, Y., Saner, P., Philipson, C., Bagchi, R., Ong, R.C., & Hector, A. (2010) Effects of seed predators of different body size on seed mortality in bornean logged forest. PLoS ONE, 5, .
Heil, M. (2014) Herbivore-induced plant volatiles: Targets, perception and unanswered questions. Journal of Physiology, 204, 297–306.
Heiniger, C., Barot, S., Ponge, J.F., Salmon, S., Botton-Divet, L., Carmignac, D., & Dubs, F. (2014) Effect of habitat spatiotemporal structure on collembolan diversity. Pedobiologia, 57, 103–117.
Hemming, J.D.C. & Lindroth, R.L. (1995) Intraspecific variation in aspen phytochemistry: effects on performance of gypsy moths and forest tent caterpillars. Oecologia, 103, 79–88.
Hendrickx, F., Maelfait, J.P., Desender, K., Aviron, S., Bailey, D., Diekotter, T., Lens, L., Liira, J., Schweiger, O., Speelmans, M., Vandomme, V., & Bugter, R. (2009) Pervasive effects of dispersal limitation on within- and among-community species richness in agricultural landscapes. Global Ecology and Biogeography, 18, 607–616.
Herms, D.A. & Mattson, W.J. (1992) The Dilemma of Plants : To Grow or Defend. The Quarterly
Review of Biology, 67, 283–335.
Hermy, M. & Verheyen, K. (2007) Legacies of the past in the present-day forest biodiversity: a review of past land-use effects on forest plant species composition and diversity. Ecological Research, 22, 361–371.
Hernández, M.I.M., Barreto, P.S.C.S., Costa, V.H., Creão-Duarte, A.J., & Favila, M.E. (2014) Response of a dung beetle assemblage along a reforestation gradient in Restinga forest. Journal of Insect Conservation, 18, 539–546.
Herrera, C.M. (coordinador) (2004) El monte mediterráneo en Andalucía. Consejería de Medio Ambiente, Junta de Andalucía, Sevilla.
HilleRisLambers, J., Adler, P.B., Harpole, W.S., Levine, J.M., & Mayfield, M.M. (2012) Rethinking Community Assembly through the Lens of Coexistence Theory. Annual Review of Ecology,
Evolution, and Systematics, 43, 227–248.
Hoekstra, J.M., Boucher, T.M., Ricketts, T.H., & Roberts, C. (2005) Confronting a biome crisis:

122
Global disparities of habitat loss and protection. Ecology Letters, 8, 23–29.
Holyoak, M., Leibold, M.., & Holt, R.D. (2005) Metacommunities: Spatial Dynamics and
Ecological Communities. University of Chicago Press, Chicago.
Houlahan, J.E., Currie, D.J., Cottenie, K., Cumming, G.S., Ernest, S.K.M., Findlay, C.S., Fuhlendorf, S.D., Gaedke, U., Legendre, P., Magnuson, J.J., McArdle, B.H., Muldavin, E.H., Noble, D., Russell, R., Stevens, R.D., Willis, T.J., Woiwod, I.P., & Wondzell, S.M. (2007) Compensatory dynamics are rare in natural ecological communities. Proceedings of the
National Academy of Sciences, 104, 3273–3277.
Hubbell, S.P. (1997) A unified theory of biogeography and relative species abundance and its application to tropical rain forests and coral reefs. Coral Reefs, 16, S9–S21.
Hubbell, S.P. (2001) The Unified Neutral Theory of Biodiversity and Biogeography. Monographs
in Population Biology, 32, 375.
Hubbell, S.P. (2006) Neutral theory and the evolution of ecological equivalence. Ecology, 87, 1387–1398.
Hughes, A.R., Inouye, B.D., Johnson, M.T.J., Underwood, N., & Vellend, M. (2008) Ecological consequences of genetic diversity. Ecology Letters, 11, 609–623.
Hughes, J. & Vogler, A.P. (2004) The phylogeny of acorn weevils (genus Curculio) from mitochondrial and nuclear DNA sequences: the problem of incomplete data. Molecular
Phylogenetics and Evolution, 601–615.
Hulme, P.E. (1998) Post-dispersal seed predation: consequences for plant demography and evolution. Perspectives in Plant Ecology, Evolution and Systematics, 1, 32–46.
Inoue, T. (2003) Chronosequential change in a butterfly community after clear-cutting of deciduous forests in a cool temperate region of central Japan. Entomological Science, 6, 151–163.
Iriarte-Goni, I. (2013) Forests, Fuelwood, Pulpwood, and Lumber in Spain, 1860-2000: A Non-Declensionist Story. Environmental History, 18, 333–359.
Ito, M. & Ozaki, K. (2005) Response of a gall wasp community to genetic variation in the host plant Quercus crispula: a test using half-sib families. Acta Oecologica, 27, 17–24.
Jackson, S.T. & Sax, D.F. (2010) Balancing biodiversity in a changing environment: extinction debt, immigration credit and species turnover. Trends in Ecology and Evolution, 25, 153–160.
Jamoneau, A., Chabrerie, O., Closset-Kopp, D., & Decocq, G. (2012) Fragmentation alters beta-diversity patterns of habitat specialists within forest metacommunities. Ecography, 35, 124–133.
Janzen, D.H. (1971) Euglossine bees as long-distance pollinators of tropical plants. Science, 171, 203–205.
Jeffries, J.M., Marquis, R.J., & Forkner, R.E. (2006) Forest age influences oak insect herbivore community structure, richness, and density. Ecological Applications, 16, 901–912.
Jensen, T.S. & Nielsen, O.F. (1986) Rodents as seed dis- persers in a heath-oak wood succession. Oecologia, 70, 214–221.
Jimenez-Pino, A. (2011) Spatial distribution of Cydia fagiglandana (Zeller) in an exploited holm oak (Quercus ilex L.) forest. Spanish Journal of …, 9, 570–579.

123
Jiménez, A., Soria, F.J., Villagrán, M., & Ocete, M.E. (2006) Seguimiento del ciclo biológico de Cydia fagiglandana (Zeller) (Lepidoptera: Tortricidae) en un encinar del sur de España. Bol
San Veg Plagas, 32, 159–168.
Jombart, T., Devillard, S., & Balloux, F. (2010) Discriminant analysis of principal components: a new method for the analysis of genetically structured populations. BMC Genetics, 11:94.
Karban, R., Shiojiri, K., Huntzinger, M., & McCall, A.C. (2006) Damage-induced resistance in sagebrush: Volatiles are key to intra- and interplant communication. Ecology, 87, 922–30.
Keenan, R.J., Reams, G.A., Achard, F., de Freitas, J. V., Grainger, A., & Lindquist, E. (2015) Dynamics of global forest area: Results from the FAO Global Forest Resources Assessment 2015. Forest Ecology and Management, 352, 9–20.
Kimura, M. (1983) The Neutral Theory of Molecular Evolution. Cambridge University Press, New York.
Kivelä, S.M., Välimäki, P., & Gotthard, K. (2016) Evolution of alternative insect life histories in stochastic seasonal environments. Ecology and Evolution, 6, 5596–5613.
Koenig, W.D., Knops, J.M.H., Carmen, W.J., Stanback, M.T., & Mumme, R.L. (1994) Estimating acorn crops using visual surveys. Canadian Journal of Forest Research, 24, 2105–2112.
Koivula, M., Kukkonen, J., & Niemela, J. (2002) Boreal carabid-beetle (Coleoptera, Carabidae) assemblages along the clear-cut originated succession gradient. Biodiversity and
Conservation, 11, 1269–1288.
Kotanen, P.M. & Rosenthal, J.P. (2000) Tolerating herbivory: Does the plant care if the herbivore has a backbone? Evolutionary Ecology, 14, 537–549.
Kruess, A. (2003) Effects of landscape structure and habitat type on a plant-herbivore-parasitoid community. Ecography, 26, 283–290.
Kuussaari, M., Bommarco, R., Heikkinen, R.K., Helm, A., Krauss, J., Lindborg, R., Öckinger, E., Pärtel, M., Pino, J., Rodà, F., Stefanescu, C., Teder, T., Zobel, M., & Steffan-Dewenter, I. (2009) Extinction debt: a challenge for biodiversity conservation. Trends in Ecology and
Evolution, 24, 564–571.
Kuussaari, M., Saarinen, M., Korpela, E.-L., Pöyry, J., & Hyvönen, T. (2014) Higher mobility of butterflies than moths connected to habitat suitability and body size in a release experiment. Ecology and Evolution, 4, 3800–3811.
de la Peña, E., Baeten, L., Steel, H., Viaene, N., De Sutter, N., De Schrijver, A., Verheyen, K., & Bailey, J. (2016) Beyond plant-soil feedbacks: mechanisms driving plant community shifts due to land-use legacies in post-agricultural forests. Functional Ecology, 30, 1073–1085.
De la Vega, X., Grez, A.A., & Simonetti, J.A. (2012) Is top-down control by predators driving insect abundance and herbivory rates in fragmented forests? Austral Ecology, 37, 836–844.
Lambin, E.F. & Geist, H. (2006) Land-use and land-cover change: local processes and global
impacts. Springer, Berlin.
Lance, D.R. (1983) Host-seeking behavior of the gypsy moth: the influence of polyphagy and highly apparent host plants. Herbivorous Insects: Host seeking Behavior and Mechanisms (ed. by S. Ahmad), pp. 201–24. Academic Press, New York.
Laurance, W.F., Lovejoy, T.E., Vasconcelos, H.L., Bruna, E.M., Didham, R.K., Stouffer, P.C.,

124
Gascon, C., Bierregaard, R.O., Laurance, S.G., & Sampaio, E. (2002) Ecosystem decay of Amazonian forest fragments: a 22-year investigation. Conservation Biology, 16, 605–618.
Lawton, J.H. (1983) Plant architecture and the diversity of phytophagous insects. Annual
review of entomology, 28, 23–39.
Lawton, J.H., Bignell, D.E., Bolton, B., Bloemers, G.F., Eggleton, P., Hammond, P.M., Hodda, M., Holt, R.D., Larsen, T.B., Mawdsley, N.A., Stork, N.E., Srivastava, D.S., & Watt, A.D. (1998) Biodiversity inventories, indicator taxa and effects of habitat modificationin tropical forest. Nature, 391, 72–76.
Lefèvre, F. & Fady, B. (2016) Introduction to Mediterranean Forest Systems: Mediterranean Basin. Insects and Diseases of Mediterranean Forest Systems (ed. by T. Paine and F. Lieutier), pp. 7–28. Springer,
Legendre, P. & Gallagher, E.D. (2001) Ecologically meaningful transformations for ordination of species data. Oecologia, 129, 271–280.
Leibold, M.A., Holyoak, M., Mouquet, N., Amarasekare, P., Chase, J.M., Hoopes, M.F., Holt, R.D., Shurin, J.B., Law, R., Tilman, D., Loreau, M., & Gonzalez, A. (2004) The metacommunity concept: A framework for multi-scale community ecology. Ecology
Letters, 7, 601–613.
Leibold, M.A. & McPeek, M.A. (2006) Coexistence of the niche and neutral perspectives in community ecology. Ecology, 87, 1399–1410.
Leimu, R., Mutikainen, P., Koricheva, J., & Fischer, M. (2006) How general are positive relationships between plant population size, fitness and genetic variation? Journal of
Ecology, 94, 942–952.
Lemoine, N.P., Burkepile, D.E., & Parker, J.D. (2017) Insect herbivores increase mortality and reduce tree seedling growth of some species in temperate forest canopy gaps. PeerJ, 5, e3102.
Levin, S.A. (1974) Dispersion and Population Interactions. The American Naturalist, 108, 207–228.
Lionello, P., Malanotte.Rizzoli, P., & Boscolo, R. (2006) Mediterranean Climate Variability.
Elsevier Science, Southampton, UK.
Lloret, F., Calvo, E., Pons, X., & Díaz-Delgado, R. (2002) Wildfires and landscape patterns in the Eastern Iberian Peninsula. Landscape Ecology, 17, 745–759.
Lomolino, M. V. (1994) Species richness of mammals inhabiting nearshore archipelagoes: area, isolation, and immigration filters. Journal of Mammalogy, 75, 39–49.
Loo, J.A. (2009) The role of forest in the preservation of biodiversity. FORESTS AND FOREST
PLANTS (ed. by J.N. Owens and H.G. Lund), pp. 364. EOLSS Publications,
López-Sánchez, A., San Miguel, A., López-Carrasco, C., Huntsinger, L., & Roig, S. (2016) The important role of scattered trees on the herbaceous diversity of a grazed Mediterranean dehesa. Acta Oecologica, 76, 31–38.
Loreau, M., Mouquet, N., & Holt, R.D. (2003) Meta-ecosystems: A theoretical framework for a spatial ecosystem ecology. Ecology Letters, 6, 673–679.
Macarthur, R. & Levins, R. (1967) The Limiting Similarity, Convergence, and Divergence of Coexisting Species. The American Naturalist, 101, 377–385.

125
MacArthur, R.H. & Wilson, E.O. (1963) An equilibrium theory of insular zoogeography. Evolution, 17, 373–387.
MacArthur, R.H. & Wilson, E.O. (1967) The Theory of Island Biogeography. Princeton University Press, New Jersey, USA.
Mack, A.L. (1998) An advantage of large seed size: tolerating rather than succumbing to seed predators. Biotropica, 30, 604–608.
Maguire, D.Y., Buddle, C.M., & Bennett, E.M. (2016) Within and Among Patch Variability in Patterns of Insect Herbivory Across a Fragmented Forest Landscape. Plos One, 11, e0150843.
Maguire, D.Y., James, P.M.A., Buddle, C.M., & Bennett, E.M. (2015) Landscape connectivity and insect herbivory: A framework for understanding tradeoffs among ecosystem services. Global Ecology and Conservation, 4, 73–84.
Maldonado-López, Y., Cuevas-Reyes, P., González-Rodríguez, A., Pérez-López, G., Acosta-Gómez, C., & Oyama, K. (2014) Relationships among plant genetics, phytochemistry and herbivory patterns in Quercus castanea across a fragmented landscape. Ecological
Research, 30, 133–143.
Maldonado-López, Y., Cuevas-Reyes, P., Stone, G.N., Nieves-Aldrey, J.L., & Oyama, K. (2015) Gall wasp community response to fragmentation of oak tree species : importance of fragment size and isolated trees. Ecosphere, 6, 31.
Manning, A.D., Fischer, J., & Lindenmayer, D.B. (2006) Scattered trees are keystone structures—implications for conservation. Biological Conservation, 132, 311–321.
Maron, J.L. & Crone, E. (2006) Herbivory: effects on plant abundance, distribution and population growth. Proceedings of the Royal Society B: Biological Sciences, 273, 2575–2584.
Marquis, R.J., Lill, J.T., & Piccinni, A. (2002a) Effect of plant architecture on colonization and damage by leaftying caterpillars of Quercus alba. Oikos, 99, 531–37.
Marquis, R.J., Lill, J.T., & Piccinni, a (2002b) Effect of plant architecture on colonization and damage by leaftying caterpillars of Quercus alba. Oikos, 99, 531–537.
Marull, J., Pino, J., Tello, E., & Cordobilla, M.J. (2010) Social metabolism, landscape change and land-use planning in the Barcelona Metropolitan Region. Land use policy, 27, 497–510.
Matthews, T.J. & Whittaker, R.J. (2014) Neutral theory and the species abundance distribution: recent developments and prospects for unifying niche and neutral perspectives. Ecology
and Evolution, 4, 2263–2277.
McCoy, E. & Bell, S. (1991) Habitat structure: The evolution and diversification of a complex topic. Habitat structure: The physical arrangement of objects in space (ed. by S. Bell, E. McCoy, and H. Mushinsky), pp. 3–27. Chapman and Hall, London.
McCrea, K.D. & Abrahamson, W.G. (1987) Variation in herbivore infestation: historical vs. genetic factors. Ecology, 68, 822–827.
McGeoch, M.A. & Gaston, K.J. (2000) Edge effects on the prevalence and mortality factors of Phytomyza ilicis (Diptera, Agromyzidae) in a suburban woodland. Ecology Letters, 3, 23–29.
McIntyre, N.E., Rango, J., Fagan, W.F., & Faeth, S.H. (2001) Ground arthropod community

126
structure in a heterogeneous urban environment. Landscape and Urban Planning, 52, 257–274.
Meiner, A. & Pedroli, B. (2017) Landscapes in transition An account of 25 years of land cover change in Europe. .
Menu, F. & Debouzie, D. (1993) Coin-flipping plasticity and prolonged diapause in insects: example of the chestnut weevil Curculio elephas (Coleoptera:Curculionidae). Oecologia, 93, 367–373.
Meyfroidt, P. & Lambin, E.F. (2011) Global forest transition: prospects for an end to deforestation. Annual Review of Environment and Resources, 36, 343–371.
Mitton, J.B. & Jeffers, R.M. (1989) The genetic consequences of mass selection for growth rate in Engelmann spruce. Silvae Genetica, 38, 6–12.
Mopper, S., Mitton, J.B., Whitman, T.G., Cobb, N.S., & Christensen, K.M. (1991) Genetic differentiation and heterozygosity in pinyon pine associated with resistance to herbivory and environmental stress. Evolution, 45, 989–999.
Moreira, X., Abdala-Roberts, L., Parra-Tabla, V., & Mooney, K.A. (2014) Positive effects of plant genotypic and species diversity on anti-herbivore defenses in a tropical tree species. PLoS
ONE, 9, e105438.
Moreira, X., Glauser, G., & Abdala-Roberts, L. (2017) Interactive effects of plant neighbourhood and ontogeny on insect herbivory and plant defensive traits. Scientific Reports, 7, 4047.
Müller, J. & Goßner, M. (2007) Single host trees in a closed forest canopy matrix: A highly fragmented landscape? Journal of Applied Entomology, 131, 613–620.
Muñoz, A., Bonal, R., & Espelta, J.M. (2014) Acorn - weevil interactions in a mixed-oak forest: Outcomes for larval growth and plant recruitment. Forest Ecology and Management, 322, 98–105.
Murphy, H.T. & Lovett-Doust, J. (2004) Context and connectivity in plant metapopulations and landscape mosaics: Does the matrix matter? Oikos, 105, 3–14.
Musolin, D.L.. (2007) Insects in a warmer world: ecological, physiological and life-history responses of true bugs (Heteroptera) to climate change. Global Change Biology, 13, 1565–1585.
Nieminen, M. (1996) Migration of moth species in a network of small islands. Oecologia, 108, 643–651.
Novotny, V. & Missa, O. (2000) Local versus regional species richness in tropical insects: one lowland site compared with the island of New Guinea. Ecological Entomology, 25, 445–451.
Onoda, Y., Schieving, F., & Anten, N.P.R. (2008) Effects of Light and Nutrient Availability on Leaf Mechanical Properties of Plantago major: A Conceptual Approach. Annals of Botany, 101, 727–736.
Opdam, P. & Wascher, D. (2004) Climate change meets habitat fragmentation: linking landscape and biogeographical scale levels in research and conservation. Biological
Conservation, 117, 285–297.
Orrock, J.L. & Damschen, E.I. (2005) Corridors cause differential seed predation. Ecological
Applications, 15, 793–798.

127
Orrock, J.L., Danielson, B.J., Burns, M.J., & Levey, D.J. (2003) Spatial Ecology of Predator-Prey Interactions : Corridors and Patch Shape Influence Seed Predation. Ecology, 84, 2589–2599.
Ortego, J., Bonal, R., & Muñoz, A. (2010) Genetic consequences of habitat fragmentation in long-lived tree species: The case of the mediterranean holm oak (Quercus ilex, L.). Journal
of Heredity, 101, 717–726.
Osier, T.L., Hwang, S.Y., & Lindroth, R.L. (2000) Effects of phytochemical variation in quaking aspen Populus tremuloides clones on gypsy moth Lymantria dispar performance in the field and laboratory. Ecological Entomology, 25, 197–207.
Papadopoulou, A., Anastasiou, I., Spagopoulou, F., Stalimerou, M., Terzopoulou, S., Legakis, A., & Vogler, A.P. (2011) Testing the species--genetic diversity correlation in the Aegean archipelago: toward a haplotype-based macroecology? The American Naturalist, 178, 241–255.
Paradis, E. (2010) pegas: an R package for population genetics with an integrated-modular approach. Bioinformatics, 26, 419–420.
Pare, P.W. & Tumlinson, J.H. (1999) Plant volatiles as a defense against insect herbivores. Plant
Physiology, 121, 325–331.
Partridge, L. & Farquhar, M. (1983) Lifetime mating success of male fruitflies (Drosophila melanogaster) is related to their size. Animal Behaviour, 31, 871–877.
Pearse, I.S. (2011) The role of leaf defensive traits in oaks on the preference and performance of a polyphagous herbivore, Orgyia vetusta. Ecological Entomology, 36, 635–642.
Pélisson, P.F., Bel-Venner, M.C., Giron, D., Menu, F., & Venner, S. (2013a) From Income to Capital Breeding: When Diversified Strategies Sustain Species Coexistence. PLoS ONE, 8, 1–7.
Pélisson, P.F., Bel-Venner, M.C., Rey, B., Burgevin, L., Martineau, F., Fourel, F., Lecuyer, C., Menu, F., & Venner, S. (2012) Contrasted breeding strategies in four sympatric sibling insect species: When a proovigenic and capital breeder copes with a stochastic environment. Functional Ecology, 26, 198–206.
Pélisson, P.F., Bernstein, C., François, D., Menu, F., & Venner, S. (2013b) Dispersal and dormancy strategies among insect species competing for a pulsed resource. Ecological
Entomology, 38, 470–477.
Pélisson, P.F., Henri, H., Bel-Venner, M.C., Allemand, R., Merville, A., Menu, F., & Venner, S. (2011) Identification at the larval stage of four Curculio species coexisting on oak trees using PCR-RFLP. Entomologia Experimentalis et Applicata, 138, 77–82.
Petit, R.J. & Excoffier, L. (2009) Gene flow and species delimitation. Trends in ecology &
evolution, 24, 386–93.
Petit, S., Griffiths, L., Smart, S.S., Smith, G.M., Stuart, R.C., & Wright, S.M. (2004) Effects of area and isolation of woodland patches on herbaceous plant species richness across Great Britain. Landscape Ecology, 19, 463– 471.
Pickett, S.T.A. & Cadenasso, M.L. (1995) Landscape ecology: spatial heterogeneity in ecological systems. Science, 269, 331– 334.
Piper, F.I., Altmann, S.H., & Lusk, C.H. (2018) Global patterns of insect herbivory in gap and understorey environments, and their implications for woody plant carbon storage. Oikos,

128
.
Plath, M., Dorn, S., Riedel, J., Barrios, H., & Mody, K. (2012) Associational resistance and associational susceptibility: specialist herbivores show contrasting responses to tree stand diversification. Oecologia, 169, 477–487.
Plieninger, T., Rolo, V., & Moreno, G. (2010) Large-scale patterns of Quercus ilex, Quercus suber, and Quercus pyrenaica regeneration in central-western Spain. Ecosystems, 13, 644–660.
Pons, J. & Pausas, J.G. (2006) Oak regeneration in heterogeneous landscapes: the case of fragmented Quercus suber forests in the eastern Iberian Peninsula. Forest Ecology and
Management, 231, 196–204.
Pons, X. (2002) MiraMon. Geographical information system and remote sensing software, .
Pons, X. (2004) MiraMon. .
Preston, F.W. (1962) The canonical distribution of commonness and rarity. Ecology, 43, 185–215.
Pritchard, J.K., Stephens, M., & Donnelly, P. (2000) Inference of population structure using multilocus genotype data. Genetics, 155, 945–959.
Pritchard, J.K. & Wen, W. (2003) Available at: http://pritch.bsd.uchicago.edu.
Puerta-Piñero, C., Pino, J., & Gómez, J.M. (2012a) Direct and indirect landscape effects on Quercus ilex regeneration in heterogeneous environments. Oecologia, 170, 1009–20.
Puerta-Piñero, C., Pino, J., & Gómez, J.M. (2012b) Direct and indirect landscape effects on Quercus ilex regeneration in heterogeneous environments. Oecologia, 170, 1009–1020.
Pulliam, H.R. (1988a) Sources, Sinks, and Population Regulation. The American naturalist, 132, 652–661.
Pulliam, R.H. (1988b) Sources, Sinks, and Population Regulation. The American Naturalist, 132, 652–661.
R Core Team (2017a) R: A language and environment for statistical computing. .
R Core Team (2017b) R: A language and environment for statistical computing. .
R Development Core Team, R. (2011) R: A Language and Environment for Statistical Computing. R Foundation for Statistical Computing, 1, 409.
Reed, D.H. & Frankham, R. (2003) Correlation between Fitness and Genetic Diversity. Conservation Biology, 17, 230–237.
Régolini, M., Castagneyrol, B., Dulaurent-Mercadal, A.M., Piou, D., Samalens, J.C., & Jactel, H. (2014) Effect of host tree density and apparency on the probability of attack by the pine processionary moth. Forest Ecology and Management, 334, 185–192.
Retana, J., Espelta, J.M., Gracia, M., & Riba, M. (1999) Seedling recruitment. Ecology of
Mediterranean Evergreen Oak Forests. Ecological Studies (Analysis and Synthesis), vol
137. (ed. by F. Rodà, J. Retana, C.A. Gracia, and J. Bellot), pp. 89–101. Springer-Verlag, Berlin, Germany.
Ribas, C.R., Sobrinho, T.G., Schoereder, J.H., Sperber, C.F., Lopes-Andrade, C., & Soares, S.M. (2005) How large is large enough for insects? Forest fragmentation effects at three

129
spatial scales. Acta Oecologica, 27, 31–41.
Ricketts, T.H., Daily, G.C., Ehrlich, P.R., & Fay, J.P. (2001) Countryside Biogeography of Moths in a Fragmented Landscape: Biodiversity in Native and Agricultural Habitats. Conservation
Biology, 15, 378–388.
Rinker, H.B. & Lowman, M.D. (2004) Insect herbivory in tropical forests. Forest Canopies (ed. by M. Lowman and H.B. Rinker), pp. 359–386. Elsevier/Academic Press, San Diego, USA.
Robinson, G. S., Ackery, P.R., Kitching, I.J., Beccaloni, G.W., & Hernández, L.M. (2010) Available at: http://www.nhm.ac.uk/our-science/data/hostplants/index.html.
Roff, D.A. (1986) The evolution of wing dimorphism in insects. Evolution, 40, 1009–1020.
Roland, J. (1993) Large-scale forest fragmentation increases the duration of tent caterpillar outbreak. Oecologia, 93, 25–30.
Roman, J. (2006) Diluting the founder effect: cryptic invasions expand a marine invader’s range. Proceedings of the Royal Society B: Biological Sciences, 273, 2453–2459.
Rosindell, J. & Cornell, S.J. (2013) Universal scaling of species-abundance distributions across multiple scales. Oikos, 122, 1101–1111.
Rosindell, J., Hubbell, S.P., & Etienne, R.S. (2011) The Unified Neutral Theory of Biodiversity and Biogeography at Age Ten. Trends in Ecology and Evolution, 26, 340–348.
Rudel, T.K., Defries, R., Asner, G.P., & Laurance, W.F. (2009) Changing drivers of deforestation and new opportunities for conservation. Conservation Biology, 23, 1396–1405.
Ruhnke, H., Schädler, M., Matthies, D., Klotz, S., & Brandl, R. (2006) Are sawflies adapted to individual host trees? A test of the adaptive deme formation hypothesis. Evolutionary
Ecology Research, 8, 1039–1048.
Ruiz-Carbayo, H., Bonal, R., Espelta, J.M., Hernández, M., & Pino, J. (2017) Community assembly in time and space: the case of Lepidoptera in a Quercus ilex L. savannah-like landscape. Insect Conservation and Diversity, 10, 21–31.
Ruiz-Carbayo, H., Bonal, R., Pino, J., & Espelta, J.M. (2018) Zero-sum landscape effects on acorn predation associated with shifts in granivore insect community in new holm oak ( Quercus ilex) forests. Diversity and Distributions, 1–14.
Sabatino, M., Maceira, N., & Aizen, M.A. (2010) Direct effects of habitat area on interaction diversity in pollination webs. Ecological Applications, 20, 1491–1497.
Sala, O.E., Iii, F.S.C., Armesto, J.J., Berlow, E., Bloomfield, J., Dirzo, R., Huber-sanwald, E., Huenneke, L.F., Jackson, R.B., Kinzig, A., Leemans, R., Lodge, D.M., Mooney, H.A., Poff, N.L., Sykes, M.T., Walker, B.H., & Walker, M. (2000) Global Biodiversity Scenarios for the Year 2100. Science, 287, 1770–1775.
Sánchez-Humanes, B. & Espelta, J.M. (2011) Increased drought reduces acorn production in Quercus ilex coppices: Thinning mitigates this effect but only in the short term. Forestry, 84, 73–82.
Schädler, M., Jung, G., Auge, H., & Brandl, R. (2003) Does the Fretwell–Oksanen model apply to invertebrates? Oikos, 100, 203–207.
Schaffner, U., Vrieling, K., & van der Meijden, E. (2003) Pyrrolizidine alkaloid content in Senecio: ontogeny and developmental constraints. Chemoecology, 13, 39–46.
130
Schultz, J.C. & Baldwin, I.T. (1982) Oak leaf quality declines in response to defoliation by gypsy moth larvae. Scin, 217, 149–51.
Schumacher, P., Weyeneth, A., Weber, D.C., & Dorn, S. (1997) Long flights in Cydia pomonella L. (Lepidoptera: Tortricidae) measured by a flight mill: Influence of sex, mated status and age. Physiological Entomology, 22, 149–160.
Scribner, K.T., Petersen, M.R., Fields, R.L., Talbot, S.L., Pearce, J.M., & Chesser, R.K. (2001) Sex-biased gene flow in spectacled eiders (Anatidae): inferences from molecular markers with contrasting modes of inheritance. Evolution, 55, 2105–2115.
Sekar, S. (2012) A meta-analysis of the traits affecting dispersal ability in butterflies: Can wingspan be used as a proxy? Journal of Animal Ecology, 81, 174–184.
Shmida, A. & Wilson, M. V. (1985) Biological Determinants of Species Diversity. Journal of
Biogeography, 12, 1–20.
Siepielski, A.M. & Benkman, C.W. (2008) Seed predation and selection exerted by a seed predator influence subalpine tree densities. Ecology, 89, 2960–2966.
Silfver, T., Roininen, H., Oksanen, E., & Rousi, M. (2009) Genetic and environmental determinants of silver birch growth and herbivore resistance. Forest Ecology and
Management, 257, 2145–2149.
Simberloff, D. (2009) The Role of Propagule Pressure in Biological Invasions. Annual Review of
Ecology, Evolution, and Systematics, 40, 415–436.
Simberloff, D.S. & Wilson, E.O. (1969) Experimental Zoogeography of Islands : The Colonization of Empty Islands. Ecology, 50, 278–296.
Simon-Bouhet, B., Garcia, P., & Viard, F. (2006) Multiple introductions promote range expansion of the mollusc Cyclope neritea (Nassariidae) in France: Evidence from mitochondrial sequence data. Molecular Ecology, 15, 1699–1711.
Siscart, D., Diego, V., & Lloret, F. (1999) Acorn ecology. The Ecology of Mediterranean
Evergreen Forests (ed. by J. Rodà, F., Gracia, C., Retana, J., Bellot), pp. 75–87. Springer- Verlag, Heidelberg, Germany.
Skoczylas, D.R., Muth, N.Z., & Niesenbaum, R.A. (2007) Contribution of insectivorous avifauna to top down control of Lindera benzoin herbivores at forest edge and interior habitats. Acta Oecologica, 32, 337–342.
SOBRINHO, T.G., SCHOEREDER, J.H., SPERBER, C.F., & MADUREIRA, M.S. (2003) Does fragmentation alter species composition in Ant communities (Hymenoptera: Formicidae)? Sociobiology, 42, 329–342.
Solla, A., Milanovic, S., Gallardo, A., Bueno, A., Corcobado, T., C??ceres, Y., Morcuende, D., Quesada, A., Moreno, G., & Pulido, F. (2016) Genetic determination of tannins and herbivore resistance in Quercus ilex. Tree Genetics and Genomes, 12, .
Soria, F.J. (1999) Curculio elephas (Gyllenhal) (Col .: Curculionidae) y Cydia fagiglandana (Zeller)(Lep .: Tortricidae) en encina (Quercus rotundifolia Lam .): infestación y relaciones interespecíficas. Bol San Veg Plagas, 25, 125–130.
Soula, B. & Menu, F. (2003) Variability in diapause duration in the chestnut weevil: mixed ESS, genetic polymorphism or bet-hedging? Oikos, 100, 574–580.
Spengler, A., Hartmann, P., Buchori, D., & Schulze, C.H. (2011) How island size and isolation

131
affect bee and wasp ensembles on small tropical islands: A case study from Kepulauan Seribu, Indonesia. Journal of Biogeography, 38, 247–258.
Spiesman, B.J. & Inouye, B.D. (2013) Habitat loss alters the architecture of plant–pollinator interaction networks. Ecology, 94, 2688–2696.
Staudt, M. & Lhoutellier, L. (2007) Volatile organic compound emission from holm oak infested by gypsy moth larvae: evidence for distinct responses in damaged and undamaged leaves. Tree physiology, 27, 1433–1440.
Stricker, K.B. & Stiling, P. (2012) Herbivory by an introduced asian weevil negatively affects population growth of an invasive Brazilian shrub in Florida. Ecology, 93, 1902–1911.
Suez, M. (2012) Prolonged diapause and temporal gene flow within invasive populations of
Mediterranean Forest insects.
Summerville, K.S. & Crist, T.O. (2008) Structure and conservation of lepidopteran communities in managed forests of northeastern North America: a review. The Canadian Entomologist, 140, 475–494.
Tajima, F. (1989) Statistical method for testing the neutral mutation hypothesis by DNA polymorphism. Genetics, 123, 585–595.
Taki, H., Yamaura, Y., Okochi, I., Inoue, T., Okabe, K., & Makino, S. (2010) Effects of reforestation age on moth assemblages in plantations and naturally regenerated forests. Insect Conservation and Diversity, 3, 257–265.
Terborgh, J. (2012) Enemies maintain hyperdiverse tropical forests. American Naturalist, 179, 303–314.
Terborgh, J., Lopez, L., Nuñez, P., Rao, M., Shahabuddin, G., Orihuela, G., Riveros, M., Ascanio, R., Adler, G.H., Lambert, T.D., & Balbas, L. (2001) Ecological Meltdown in Predator-Free Forest Fragments. Science, 294, 1923–1926.
Terradas, J. (1999) Holm Oak and Holm Oak Forests: An Introduction. Ecology of
Mediterranean Evergreen Oak Forests. Ecological Studies (Analysis and Synthesis), vol
137. (ed. by F. Rodà, J. Retana, C.A. Gracia, and J.. Bellot), Springer, Berlin, Heidelberg,
Terradas, J. & Savé, R. (1992) The influence of summer and winter stress and water relationships on the distribution of Quercus ilex L. Vegetatio, 99, 137–145.
Thies, C., Steffan-Dewenter, I., & Tscharntke, T. (2003) Effects of landscape context on herbivory and parasitism at different spatial scales. Oïkos, 101, 18–25.
Thomas, C.D., Jordano, D., Lewis, O.T., Hill, J.K., Sutcliffe, O.L., & Thomas, J.A. (1998) Butterfly distributional patterns, processes, and conservation. Conservation in a changing world (ed. by G.M. Mace, A. Balmford, and J.R. Ginsberg), pp. 107–138. Cambridge University Press, Cambridge, UK.
Thomas, J.A., Bourn, N.A.D., Clarke, R.T., Stewart, K.E., Simcox, D.J., Pearman, G.S., Curtis, R., & Goodger, B. (2001) The quality and isolation of habitat patches both determine where butterflies persist in fragmented landscapes. Proceedings of the Royal Society of London.
Series B: Biological Sciences, 268, 1791–1796.
Thompson, P.L. & Gonzalez, A. (2017) Dispersal governs the reorganization of ecological networks under environmental change. Nature Ecology and Evolution, 1, 162.
Tilman, D. (2004) Niche tradeoffs, neutrality, and community structure: A stochastic theory of

132
resource competition, invasion, and community assembly. Proceedings of the National
Academy of Sciences, 101, 10854–10861.
Timm, A.E. & Geertsema, H. (2008) Population Genetic Structure of Grapholita molesta ( Lepidoptera : Tortricidae ) in South Africa. Annals of the Entomological Society of
America, 101, 197–203.
Toju, H. & Sota, T. (2006) Phylogeography and the geographic cline in the armament of a seed-predatory weevil: Effects of historical events vs. natural selection from the host plant. Molecular Ecology, 15, 4161–4173.
Toju, H., Ueno, S., Taniguchi, F., & Sota, T. (2011) Metapopulation structure of a seed-predator weevil and its host plant in arms race coevolution. Evolution, 65, 1707–1722.
Tscharntke, T. & Brandl, R. (2004) Plant-insect interactions in fragmented landscapes. Annual
review of entomology, 49, 405–30.
Tscharntke, T., Steffan-Dewenter, I., Kruess, A., & Thies, C. (2002) Characteristics of insect populations on habitat fragments A mini review, Ecological Research Volume 17, Issue 2. Ecological Research, 17, 229–239.
Tscharntke, T., Tylianakis, J.M., Rand, T.A., et al. (2012) Landscape moderation of biodiversity patterns and processes - eight hypotheses. Biological Reviews, 87, 661–685.
Turner, M.G., Gardner, R.H., & O’Neill, R. V. (2001) Landscape Ecology in Theory and Practice:
Patterns and Processes. Springer, New York.
Ulrich, W. & Zalewski, M. (2007) Are ground beetles neutral? Basic and Applied EcologyApplied
Ecology, 8, 411–420.
Urbas, P., Araújo, M. V., Leal, I.R., & Wirth, R. (2007) Cutting more from cut forests: edge effects on foraging and herbivory of leaf-cutting ants in Brazil. Biotropica, 39, 489–495.
Valencia-Cuevas, L. & Tovar-Sánchez, E. (2015) Oak canopy arthropod communities: which factors shape its structure? Revista Chilena de Historia Natural, 88, 15.
Valiente-Banuet, A., Aizen, M.A., Alcántara, J.M., Arroyo, J., Cocucci, A., Galetti, M., García, M.B., García, D., Gómez, J.M., Jordano, P., Medel, R., Navarro, L., Obeso, J.R., Oviedo, R., Ramírez, N., Rey, P.J., Traveset, A., Verdú, M., & Zamora, R. (2015) Beyond species loss: The extinction of ecological interactions in a changing world. Functional Ecology, 29, 299–307.
Venable, D.L. & Brown, J.S. (1988) The selective interactions of dispersal, dormancy, and seed size as adaptations for reducing risk in variable environments. The American Naturalist, 131, 360–384.
Venable, D.L. & Lawlor, L. (1980) Delayed germination and dispersal in desert annuals: escape in space and time. Oecologia, 46, 272–282.
Venner, S., Pélisson, P.F., Bel-Venner, M.C., Débias, F., Rajon, E., & Menu, F. (2011) Coexistence of insect species competing for a pulsed resource: Toward a unified theory of biodiversity in fluctuating environments. PLoS ONE, 6, e18039.
Vergnon, R., van Nes, E.H., & Scheffer, M. (2012) Emergent neutrality leads to multimodal species abundance distributions. Nature Communications, 3, 663.
Vilà-Cabrera, A., Espelta, J.M., Vayreda, J., & Pino, J. (2017) “New Forests” from the Twentieth Century are a Relevant Contribution for C Storage in the Iberian Peninsula. Ecosystems,

133
20, 130–143.
Vitousek, P.M., Mooney, H.A., Lubchenco, J., & Melillo, J.M. (1997) Urban ecology: An international perspective on the interaction between humans and nature. Science, 277, 494–499.
Voisin, M., Engel, C., & Viard, F. (2005) Differential shuffling of native genetic diversity across introduced regions in a brown alga: aquaculture vs. maritime traffic effects. Proceedings
of the National Academy of Sciences of the United States of America, 102, 5432–5437.
Wang, S. & Loreau, M. (2016) Biodiversity and ecosystem stability across scales in metacommunities. Ecology Letters, 19, 510–518.
Weissflog, A., Markesteijn, L., Lewis, O.T., Comita, L.S., & Engelbrecht, B.M.J. (2018) Contrasting patterns of insect herbivory and predation pressure across a tropical rainfall gradient. Biotropica, 50, 302–311.
West, C. (1985) Factors underlying the late seasonal appearance of the lepidopterous leaf-mining guild on oak. Ecological Entomology, 10, 111–120.
Williams, C.B. (1964) Patterns in the balance of nature. Academic Press, New York.
Wirth, R., Meyer, S.T., Wirth, R., Meyer, S.T., Leal, I.R., & Tabarelli, M. (2008) Plant herbivore interactions at the forest edge. Series Progress in Botany 69 (ed. by U. Luttge, W. Beyschlag, D. Francis, J. Cushman, and M. Weigend), pp. 423–448. Springer, Berlin, Germany.
Woodward, G., Benstead, J.P., Beveridge, O.S., et al. (2010) Ecological networks in a changing climate. Advances in Ecological Research, 42, 71–138.
Wright, S. (1931) Evolution in Mendelian populations. Genetics, 16, 97.
Wright, S.J. (2002) Plant diversity in tropical forests: a review of mechanisms of species coexistence. Oecologia, 130, 1–14.
Zavala, M.A., Espelta, J.M., Caspersen, J., & Retana, J. (2011) Interspecific differences in sapling performance with respect to light and aridity gradients in Mediterranean pine–oak forests: implications for species coexistence. Canadian Journal of Forest Research, 41, 1432–1444.
Zera, A.J. & Harshman, L.G. (2001) The physiology of life-history trade-offs in animals. Annual
Review of Ecology and Systematics, 32, 95–126.
Zera, A.J., Sall, J., & Grudzinski, L. (1997) Flight muscle polymorphism in the cricket Gryllus firmus: muscle characteristics and their influence on the evolution of flightlessness. Physiological Zoology, 70, 519–529.
Züst, T. & Agrawal, A.A. (2016) Mechanisms and evolution of plant resistance to aphids. Nature
Plants, 2, 15206.

134
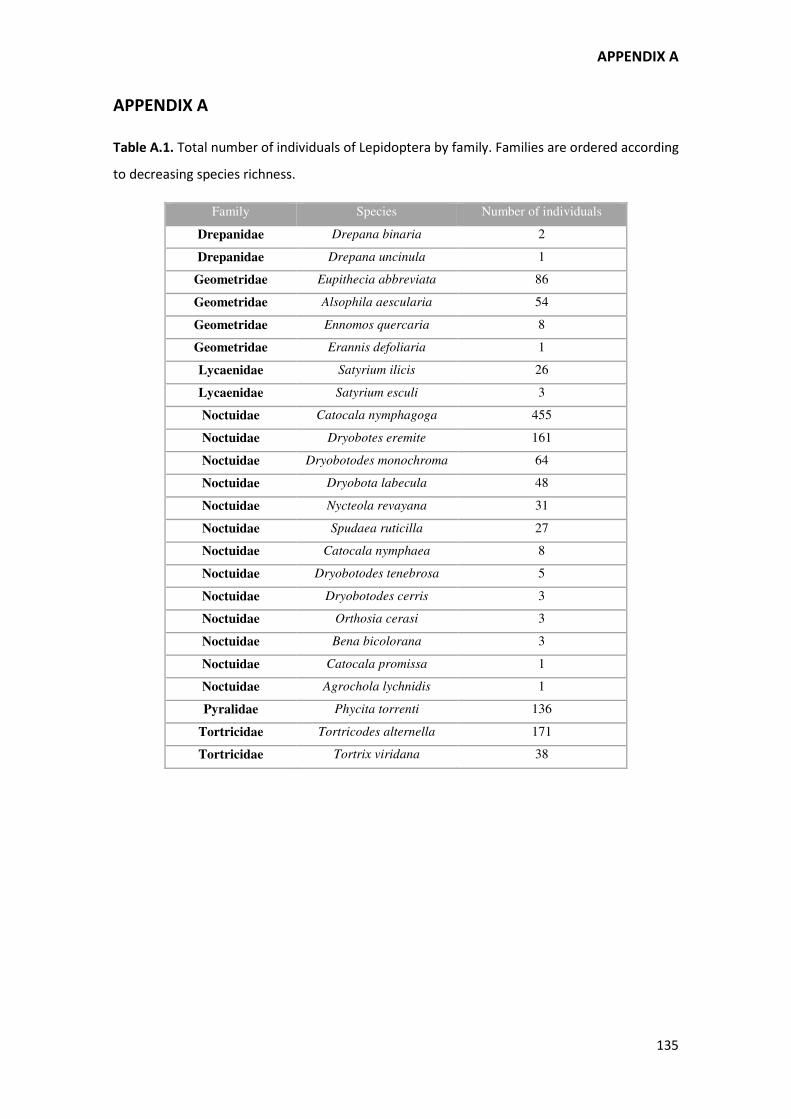
APPENDIX A
135
APPENDIX A
Table A.1. Total number of individuals of Lepidoptera by family. Families are ordered according
to decreasing species richness.
Family Species Number of individuals
Drepanidae Drepana binaria 2
Drepanidae Drepana uncinula 1
Geometridae Eupithecia abbreviata 86
Geometridae Alsophila aescularia 54
Geometridae Ennomos quercaria 8
Geometridae Erannis defoliaria 1
Lycaenidae Satyrium ilicis 26
Lycaenidae Satyrium esculi 3
Noctuidae Catocala nymphagoga 455
Noctuidae Dryobotes eremite 161
Noctuidae Dryobotodes monochroma 64
Noctuidae Dryobota labecula 48
Noctuidae Nycteola revayana 31
Noctuidae Spudaea ruticilla 27
Noctuidae Catocala nymphaea 8
Noctuidae Dryobotodes tenebrosa 5
Noctuidae Dryobotodes cerris 3
Noctuidae Orthosia cerasi 3
Noctuidae Bena bicolorana 3
Noctuidae Catocala promissa 1
Noctuidae Agrochola lychnidis 1
Pyralidae Phycita torrenti 136
Tortricidae Tortricodes alternella 171
Tortricidae Tortrix viridana 38

APPENDIX A
136
Table A.2. Habitat drivers and community variables included in the study. First column represent tree descriptors.
Community variables are expressed as annual means ± standard deviation. Units of measure are indicated in
brackets.
Habitat drivers
Community variables Tree
ID
Age
(years)
Crown size
(m2)
Connectivity
(m2) LAI
Species abundance
(number of individuals)
Species richness
(number of species)
Species Diversity
(Shannon’s Diversity)
1 34 43 451 1,98 5.0 ± 4.5 2.6 ± 2.3 2.2 ± 2.0
2 64 104 307 2,48 3.6 ± 3.3 2.4 ± 1.9 2.4 ± 2.0
3 40 81 214 2,77 3.2 ± 2.2 2.6 ± 1.8 2.7 ± 2.0
4 20 29 109 0,79 4.2 ± 3.4 2.0 ± 1.0 1.8 ± 0.7
5 38 72 163 2,32 19.6 ± 16.8 4.4 ± 1.9 3.1 ± 1.2
6 49 91 156 2,69 15.0 ± 5.1 5.0 ± 1.0 3.5 ± 0.7
7 49 73 93 3,35 20.8 ± 15.4 4.8 ± 1.3 3.6 ± 1.1
8 52 26 83 1,51 19.8 ± 16.6 4.2 ± 1.9 3.4 ± 1.8
9 50 104 545 3,40 5.8 ± 6.0 3.0 ± 2.0 2.6 ± 2.2
10 43 89 565 2,54 8.4 ± 5.8 3.0 ± 1.9 2.4 ± 1.3
11 60 94 15704 3,15 17.4 ± 9.3 5.4 ± 1.1 4.0 ± 1.7
12 68 99 15052 3,25 12.4 ± 7.6 3.6 ± 1.7 2.8 ± 1.2
13 56 62 9838 3,54 24.8 ± 20.9 5.0 ± 3.9 3.2 ± 6.9
14 50 72 8963 3,61 12.0 ± 11.0 4.8 ± 2.2 4.0 ± 2.6
15 66 79 23169 2,81 13.8 ± 10.0 5.0 ± 3.3 4.0 ± 5.3
16 67 75 23362 2,39 17.4 ± 3.4 5.8 ± 2.8 4.4 ± 5.4
17 39 26 22667 2,56 6.6 ± 5.6 3.4 ± 2.6 3.2 ± 4.2
18 57 67 22842 1,49 9.2 ± 5.6 4.0 ± 2.0 3.1 ± 3.2
19 74 32 21256 1,87 8.2 ± 5.3 3.8 ± 2.5 3.3 ± 3.5
20 49 32 21161 2,15 14.0 ± 9.9 5.6 ± 3.8 4.0 ± 4.8
21 46 27 18116 2,55 15.8 ± 12.1 4.2 ± 1.9 3.2 ± 1.9
22 35 12 436 1,66 8.6 ± 6.8 3.2 ± 1.1 2.7 ± 0.5
23 33 43 318 1,57 5.2 ± 3.3 2.8 ± 1.1 2.4 ± 0.7
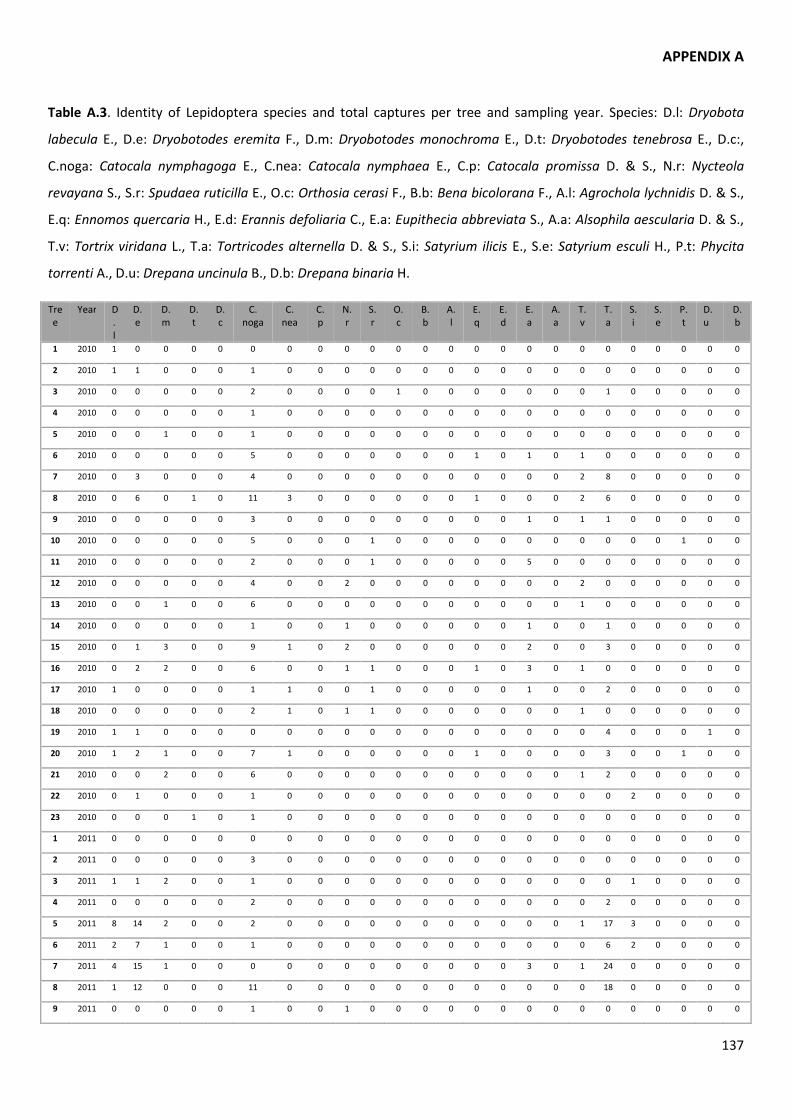
APPENDIX A
137
Table A.3. Identity of Lepidoptera species and total captures per tree and sampling year. Species: D.l: Dryobota
labecula E., D.e: Dryobotodes eremita F., D.m: Dryobotodes monochroma E., D.t: Dryobotodes tenebrosa E., D.c:,
C.noga: Catocala nymphagoga E., C.nea: Catocala nymphaea E., C.p: Catocala promissa D. & S., N.r: Nycteola
revayana S., S.r: Spudaea ruticilla E., O.c: Orthosia cerasi F., B.b: Bena bicolorana F., A.l: Agrochola lychnidis D. & S.,
E.q: Ennomos quercaria H., E.d: Erannis defoliaria C., E.a: Eupithecia abbreviata S., A.a: Alsophila aescularia D. & S.,
T.v: Tortrix viridana L., T.a: Tortricodes alternella D. & S., S.i: Satyrium ilicis E., S.e: Satyrium esculi H., P.t: Phycita
torrenti A., D.u: Drepana uncinula B., D.b: Drepana binaria H.
Tre
e
Year D
.
l
D.
e
D.
m
D.
t
D.
c
C.
noga
C.
nea
C.
p
N.
r
S.
r
O.
c
B.
b
A.
l
E.
q
E.
d
E.
a
A.
a
T.
v
T.
a
S.
i
S.
e
P.
t
D.
u
D.
b
1 2010 1 0 0 0 0 0 0 0 0 0 0 0 0 0 0 0 0 0 0 0 0 0 0 0
2 2010 1 1 0 0 0 1 0 0 0 0 0 0 0 0 0 0 0 0 0 0 0 0 0 0
3 2010 0 0 0 0 0 2 0 0 0 0 1 0 0 0 0 0 0 0 1 0 0 0 0 0
4 2010 0 0 0 0 0 1 0 0 0 0 0 0 0 0 0 0 0 0 0 0 0 0 0 0
5 2010 0 0 1 0 0 1 0 0 0 0 0 0 0 0 0 0 0 0 0 0 0 0 0 0
6 2010 0 0 0 0 0 5 0 0 0 0 0 0 0 1 0 1 0 1 0 0 0 0 0 0
7 2010 0 3 0 0 0 4 0 0 0 0 0 0 0 0 0 0 0 2 8 0 0 0 0 0
8 2010 0 6 0 1 0 11 3 0 0 0 0 0 0 1 0 0 0 2 6 0 0 0 0 0
9 2010 0 0 0 0 0 3 0 0 0 0 0 0 0 0 0 1 0 1 1 0 0 0 0 0
10 2010 0 0 0 0 0 5 0 0 0 1 0 0 0 0 0 0 0 0 0 0 0 1 0 0
11 2010 0 0 0 0 0 2 0 0 0 1 0 0 0 0 0 5 0 0 0 0 0 0 0 0
12 2010 0 0 0 0 0 4 0 0 2 0 0 0 0 0 0 0 0 2 0 0 0 0 0 0
13 2010 0 0 1 0 0 6 0 0 0 0 0 0 0 0 0 0 0 1 0 0 0 0 0 0
14 2010 0 0 0 0 0 1 0 0 1 0 0 0 0 0 0 1 0 0 1 0 0 0 0 0
15 2010 0 1 3 0 0 9 1 0 2 0 0 0 0 0 0 2 0 0 3 0 0 0 0 0
16 2010 0 2 2 0 0 6 0 0 1 1 0 0 0 1 0 3 0 1 0 0 0 0 0 0
17 2010 1 0 0 0 0 1 1 0 0 1 0 0 0 0 0 1 0 0 2 0 0 0 0 0
18 2010 0 0 0 0 0 2 1 0 1 1 0 0 0 0 0 0 0 1 0 0 0 0 0 0
19 2010 1 1 0 0 0 0 0 0 0 0 0 0 0 0 0 0 0 0 4 0 0 0 1 0
20 2010 1 2 1 0 0 7 1 0 0 0 0 0 0 1 0 0 0 0 3 0 0 1 0 0
21 2010 0 0 2 0 0 6 0 0 0 0 0 0 0 0 0 0 0 1 2 0 0 0 0 0
22 2010 0 1 0 0 0 1 0 0 0 0 0 0 0 0 0 0 0 0 0 2 0 0 0 0
23 2010 0 0 0 1 0 1 0 0 0 0 0 0 0 0 0 0 0 0 0 0 0 0 0 0
1 2011 0 0 0 0 0 0 0 0 0 0 0 0 0 0 0 0 0 0 0 0 0 0 0 0
2 2011 0 0 0 0 0 3 0 0 0 0 0 0 0 0 0 0 0 0 0 0 0 0 0 0
3 2011 1 1 2 0 0 1 0 0 0 0 0 0 0 0 0 0 0 0 0 1 0 0 0 0
4 2011 0 0 0 0 0 2 0 0 0 0 0 0 0 0 0 0 0 0 2 0 0 0 0 0
5 2011 8 14 2 0 0 2 0 0 0 0 0 0 0 0 0 0 0 1 17 3 0 0 0 0
6 2011 2 7 1 0 0 1 0 0 0 0 0 0 0 0 0 0 0 0 6 2 0 0 0 0
7 2011 4 15 1 0 0 0 0 0 0 0 0 0 0 0 0 3 0 1 24 0 0 0 0 0
8 2011 1 12 0 0 0 11 0 0 0 0 0 0 0 0 0 0 0 0 18 0 0 0 0 0
9 2011 0 0 0 0 0 1 0 0 1 0 0 0 0 0 0 0 0 0 0 0 0 0 0 0

APPENDIX A
138
10 2011 0 5 0 0 0 5 0 0 0 0 0 1 0 0 0 1 0 0 3 0 0 0 0 0
11 2011 3 2 4 0 0 3 0 0 0 3 0 0 0 0 0 0 0 0 10 1 0 0 0 0
12 2011 0 0 1 0 0 7 0 0 0 0 0 0 0 0 0 2 0 0 4 1 0 0 0 0
13 2011 0 4 5 0 0 28 0 0 1 0 0 1 0 0 0 3 0 0 8 1 0 0 0 0
14 2011 1 2 1 0 0 6 0 0 0 0 0 0 0 0 0 0 0 0 1 4 0 0 0 0
15 2011 2 4 4 1 0 5 0 0 0 0 0 0 0 0 0 0 0 0 6 0 0 0 0 0
16 2011 0 3 7 0 0 0 0 0 0 2 0 0 0 0 0 1 0 1 9 0 0 0 0 0
17 2011 0 1 0 0 0 0 0 0 0 0 0 0 0 0 0 0 0 0 1 0 0 0 0 0
18 2011 2 1 4 0 0 3 0 0 1 0 0 0 0 0 0 0 0 0 0 0 0 0 0 0
19 2011 1 1 2 0 0 3 0 0 0 0 0 0 0 0 0 0 0 0 3 1 0 0 0 0
20 2011 0 1 3 0 0 2 0 0 0 0 0 0 1 0 0 0 0 0 1 0 0 0 0 0
21 2011 0 3 5 0 0 18 0 0 1 0 0 0 0 0 0 1 0 0 0 0 0 0 0 0
22 2011 2 7 0 1 0 2 0 0 0 0 0 0 0 0 0 0 0 0 8 0 0 0 0 0
23 2011 0 1 1 0 0 7 0 0 0 0 0 0 0 0 0 0 0 0 1 0 0 0 0 0
1 2012 0 4 0 0 0 1 0 0 0 0 0 0 0 0 0 0 0 0 0 0 0 0 0 0
2 2012 1 1 0 0 0 1 0 0 0 0 0 0 0 0 0 0 0 0 0 0 0 0 0 0
3 2012 0 0 0 0 0 0 0 0 0 0 0 0 0 0 0 0 0 0 0 0 0 0 0 0
4 2012 2 7 0 0 0 1 0 0 0 0 0 0 0 0 0 0 0 0 0 0 0 0 0 0
5 2012 0 8 1 0 0 6 0 0 0 0 0 0 0 0 0 0 0 1 1 0 0 0 0 0
6 2012 0 8 0 0 0 8 0 0 0 0 0 0 0 0 0 0 0 3 0 0 0 0 0 0
7 2012 1 4 0 0 0 7 0 0 0 0 0 0 0 0 0 0 0 2 1 0 0 0 0 0
8 2012 0 5 0 1 0 5 0 0 0 0 0 0 0 0 0 0 0 0 6 0 0 2 0 0
9 2012 0 0 0 0 0 0 0 0 0 0 0 0 0 0 0 0 0 0 0 0 0 0 0 0
10 2012 0 0 0 0 0 0 0 0 0 0 0 0 0 0 0 0 0 0 0 0 0 0 0 0
11 2012 1 0 0 0 0 5 0 0 0 1 0 0 0 0 0 3 0 2 0 0 0 0 0 0
12 2012 0 0 0 0 0 4 0 0 0 0 0 0 0 0 0 0 0 0 0 0 0 0 0 0
13 2012 0 0 0 0 0 8 0 0 0 0 0 0 0 0 0 0 0 0 0 0 0 0 0 0
14 2012 0 1 0 0 0 3 0 0 0 0 0 1 0 0 0 0 0 0 0 0 0 0 0 0
15 2012 0 0 0 0 0 1 0 0 0 0 0 0 0 0 0 0 0 0 0 0 0 1 0 0
16 2012 2 2 1 0 0 1 0 0 0 1 0 0 0 0 0 4 0 2 0 0 0 1 0 0
17 2012 0 0 0 0 0 0 0 0 0 0 0 0 0 0 0 0 0 0 0 0 0 0 0 0
18 2012 0 0 0 0 0 0 0 0 0 0 0 0 0 0 0 1 0 0 0 0 0 0 0 0
19 2012 0 0 0 0 0 0 0 0 0 0 0 0 0 0 0 0 0 0 0 0 0 0 0 0
20 2012 0 0 0 0 0 0 0 0 0 0 0 0 0 0 0 0 0 0 0 0 0 0 0 0
21 2012 0 0 0 0 0 1 0 0 0 0 0 0 0 0 0 1 0 0 0 0 0 0 0 0
22 2012 0 5 1 0 0 3 0 0 0 0 0 0 0 0 0 0 0 0 0 0 0 0 0 0
23 2012 0 1 1 0 0 0 0 0 0 0 0 0 0 0 0 0 0 0 0 0 0 0 0 0
1 2013 1 2 0 0 0 5 0 0 0 0 0 0 0 0 0 1 0 0 0 0 0 1 0 0
2 2013 0 0 0 0 0 0 0 0 0 0 0 0 0 0 0 0 0 0 0 0 0 0 0 0
3 2013 1 0 0 0 0 1 0 0 0 0 0 0 0 0 0 0 0 0 1 0 0 0 0 0
4 2013 0 0 0 0 0 3 0 0 0 0 0 0 0 0 0 0 0 0 0 0 0 0 0 0
5 2013 0 1 0 0 0 8 0 0 0 0 0 0 0 0 0 1 0 1 0 0 0 1 0 0
6 2013 2 0 0 0 0 6 0 0 0 1 0 0 0 0 0 0 0 0 1 0 0 0 0 0
7 2013 0 0 1 0 0 7 0 0 0 0 0 0 0 0 0 0 0 0 2 0 0 0 0 0
8 2013 0 0 0 0 0 3 1 0 0 0 0 0 0 0 0 0 0 0 0 0 0 1 0 0

APPENDIX A
139
9 2013 0 1 0 0 0 3 0 0 0 0 0 0 0 0 0 0 0 0 0 0 0 0 0 0
10 2013 0 3 0 0 0 8 0 0 0 0 0 0 0 0 0 0 0 0 0 0 1 0 0 0
11 2013 0 0 0 0 0 4 0 0 3 0 0 0 0 0 0 0 0 0 0 0 0 2 0 0
12 2013 0 0 0 0 0 7 0 0 2 0 0 0 0 0 0 1 0 0 0 0 0 1 0 0
13 2013 0 0 0 0 0 10 0 0 0 0 0 0 0 0 0 0 0 0 0 0 0 1 0 0
14 2013 0 0 0 0 0 4 0 0 0 0 0 0 0 0 0 1 0 0 0 0 0 1 0 0
15 2013 0 0 0 0 0 4 0 0 0 0 0 0 0 0 0 0 0 0 0 0 0 0 0 0
16 2013 0 0 0 0 0 12 0 0 2 2 0 0 0 0 0 0 0 0 0 0 0 0 0 0
17 2013 0 0 0 0 0 8 0 0 0 0 0 0 0 0 0 1 0 0 0 0 2 0 0 0
18 2013 0 0 0 0 0 10 0 0 0 0 0 0 0 0 0 1 0 0 0 0 0 3 0 0
19 2013 0 1 0 0 0 7 0 0 0 0 0 0 0 0 0 0 0 0 0 0 0 1 0 0
20 2013 0 0 0 0 0 17 0 0 1 0 0 0 0 1 0 1 0 0 0 0 0 4 0 0
21 2013 0 0 0 0 0 6 0 0 0 0 0 0 0 0 0 0 0 0 2 0 0 1 0 0
22 2013 0 0 0 0 0 2 0 0 0 0 0 0 0 0 0 0 0 0 0 0 0 1 0 0
23 2013 0 0 0 0 0 5 0 0 1 0 0 0 0 0 0 0 0 0 0 0 0 0 0 0
1 2014 0 0 0 0 0 1 0 0 0 0 0 0 0 0 0 3 3 0 0 0 0 1 0 0
2 2014 1 0 1 0 0 2 0 0 0 0 0 0 0 0 0 0 1 0 0 0 0 4 0 0
3 2014 0 0 0 0 0 0 0 0 0 0 0 0 0 0 0 2 1 0 0 0 0 0 0 0
4 2014 0 0 0 0 0 0 0 0 0 0 0 0 0 0 0 1 1 0 0 0 0 1 0 0
5 2014 0 0 0 0 0 12 0 0 0 0 0 0 0 0 0 0 1 0 0 0 0 7 0 0
6 2014 1 0 0 0 0 9 0 0 0 0 0 0 0 0 0 2 1 2 0 0 0 2 0 0
7 2014 0 0 0 0 1 2 0 0 0 0 0 0 0 0 0 2 0 3 0 0 0 5 0 1
8 2014 0 0 1 0 0 0 0 0 0 0 0 0 0 0 0 0 0 0 0 0 0 2 0 0
9 2014 0 0 0 0 0 2 0 0 2 3 0 0 0 0 0 0 3 0 0 0 0 5 0 0
10 2014 0 1 0 0 0 1 0 0 0 0 0 0 0 0 0 0 0 0 0 0 0 4 0 0
11 2014 2 0 0 0 0 5 0 0 1 0 0 0 0 0 0 9 3 0 0 0 0 9 0 0
12 2014 0 0 0 0 0 8 0 0 0 0 0 0 0 0 0 0 1 0 1 3 0 11 0 0
13 2014 0 1 0 0 0 6 0 0 4 2 0 0 0 0 0 10 6 5 1 0 0 8 0 0
14 2014 0 1 2 0 0 2 0 0 0 6 0 0 0 0 0 1 7 0 0 7 0 3 0 0
15 2014 0 0 0 0 0 3 0 0 0 0 0 0 0 2 1 3 4 0 1 0 0 4 0 0
16 2014 0 0 0 0 0 3 0 0 0 1 0 0 0 0 0 0 0 0 0 0 0 12 0 0
17 2014 0 0 0 0 0 5 0 1 2 0 0 0 0 0 0 1 1 0 0 0 0 3 0 0
18 2014 1 1 0 0 1 3 0 0 0 0 0 0 0 0 0 0 5 0 0 0 0 3 0 0
19 2014 0 0 1 0 0 1 0 0 0 0 0 0 0 0 0 4 3 1 0 0 0 4 0 0
20 2014 0 0 1 0 1 0 0 0 0 0 1 0 0 1 0 2 4 1 1 0 0 8 0 0
21 2014 0 2 0 0 0 4 0 0 2 0 1 0 0 0 0 3 7 0 0 0 0 10 0 0
22 2014 0 0 0 0 0 1 0 0 0 0 0 0 0 0 0 0 0 0 0 0 0 5 0 1
23 2014 0 0 0 0 0 1 0 0 0 0 0 0 0 0 0 2 2 0 0 0 0 1 0 0

Figure A.1. Sample-based species accumulation curves for Lepidoptera in small, medium
trees.
Figure A.2. Rank-abundance curve for the Lepidoptera community,
based species accumulation curves for Lepidoptera in small, medium
abundance curve for the Lepidoptera community, from the most abundant to the rarest species.
APPENDIX A
140
based species accumulation curves for Lepidoptera in small, medium-size and large Holm oak
from the most abundant to the rarest species.

APPENDIX A
141
Table A.4 Selection of mixed effects linear models based on AIC.
Response Model Predictors Method AIC
Fixed Random
Species richness Saturated ·Tree age
·Tree canopy size
·Tree connectivity
·Tree age * Tree canopy size
· Tree age * Tree connectivity
·Tree connectivity * Tree canopy size
·Year ML 496.0154
Best ·Tree age
·Tree canopy size
·Tree connectivity
·Tree age * Tree canopy size
· Tree age * Tree connectivity
·Tree connectivity * Tree canopy size
·Year ML 496.0154
Parsimonious ·Tree connectivity
·Year ML 496.7367
Shannon’s
Diversity
Saturated ·Tree age
·Tree canopy size
·Tree connectivity
·Tree age * Tree canopy size
· Tree age * Tree connectivity
·Tree connectivity * Tree canopy size
·Year ML 405.9241
Best ·Tree age
·Tree canopy size
·Tree connectivity
·Tree age * Tree canopy size
· Tree age * Tree connectivity
·Tree connectivity * Tree canopy size
·Year ML 405.9241
Parsimonious ·Tree connectivity
·Tree age
· Tree connectivity * Tree age
·Year ML 405.4339
Log
(abundance+1)
Saturated ·Tree age
·Tree canopy size
·Tree connectivity
·Tree age * Tree canopy size
· Tree age * Tree connectivity
·Tree connectivity * Tree canopy size
·Year ML 287.1725
Best ·Tree age
·Tree canopy size
·Tree connectivity
·Tree age * Tree canopy size
· Tree age * Tree connectivity
·Tree connectivity * Tree canopy size
·Year ML 287.1725
Parsimonious -------------------- ----- ---- ----

APPENDIX A
142
Table A.5 Total, unconstrained and constrained variance, main eigenvalues, adjusted R2 and significance of the RDA
performed between Lepidoptera species and tree characteristics (predictors).
Inertia Proportion
Total 351.7 1.0000
Constrained 64.6 0.1837
Unconstrained 287.1 0.8163
Eigenvalues for
constrained axes
RDA1 RDA 2 RDA 3
40.2853 22.51940 1.79968
Eigenvalues for
unconstrained axes
PC1 PC2 PC3 PC4 PC5
170.7675 69.5162 14.59797 8.65634 7.14901
Adjusted R2 0.054
F3, 1 9 1.425
P value 0.214

Figure A.3 Redundancy Analysis biplot showing the explanatory vari
two first significant axes. Pressures are shown in bold and physical correlates in italics
t showing the explanatory variables, in relation to selected variables along the
two first significant axes. Pressures are shown in bold and physical correlates in italics
APPENDIX A
143
ables, in relation to selected variables along the

APPENDIX A
144

APPENDIX B
145
APPENDIX B
Table B.1. BIC values associated to the number of genetic clusters from cluster identification using
successive K-means.
K BIC
1 1613.621
2 1585.133
3 1572.550
4 1561.717
5 1551.524
6 1545.707
7 1541.079
8 1539.653
9 1538.226
10 1536.907
11 1536.046
12 1537.796
13 1538.045
14 1539.480
15 1541.496

APPENDIX B
146
Table B.2. Results of the intra-patch AMOVA analyses describing the partition of the total genetic
variance of Q. ilex populations at different hierarchical levels.
1- Cardedeu
Source of variation df SS Variance Percent p-value
Among stage classes 4 1043.198 2.87548 29.76 <0.001
Among individuals within stage classes 221 2006.758 2.29239 23.72 <0.001
Within individuals 226 1016.000 4.49558 46.52 <0.001
Total 451 4065.956 9.66344
2- Martorell
Source of variation df SS Variance Percent p-value
Among stage classes 4 31.268 0.02301 0.40 <0.001
Among individuals within stage classes 153 992.887 0.74473 12.91 0.986
Within individuals 158 790.000 5.00000 86.69 <0.001
Total 315 1814.155 5.76774
3- Cervelló
Source of variation df SS Variance Percent p-value
Among stage classes 4 48.736 0.06999 1.14 0.006
Among individuals within stage classes 215 1351.453 0.23837 3.90 0.004
Within individuals 220 1278.000 5.80909 94.96 <0.001
Total 439 2678.189 6.11745

APPENDIX B
147
Table B.3. Selection of mixed effects linear models based on AIC. Saturated models include all
descriptors plus their second-degree interactions (represented by an asterisk).
Response Model Predictors Method AIC
Fixed Random
Herbivory
index
Saturated · Heterozygosity percentage
· Connectivity to mature oaks
· Minimum distance to edge
· Oak age
· Heterozygosity percentage * Connectivity to
mature oaks
· Heterozygosity percentage * Minimum distance to
edge
· Heterozygosity percentage * Oak age
· Connectivity to mature oaks * Minimum distance
to edge
· Connectivity to mature oaks * Oak age
· Minimum distance to edge * Oak age
· Genetic cluster
· Site ML 3085.3
Best · Genetic cluster
·Connectivity to mature oaks
· Minimum distance to edge
· Oak age
· Connectivity to mature oaks * Oak age
· Site ML 3079.9

APPENDIX B
148
Figure B.1. Output from FST outlier analyses performed in LOSITAN testing for SNP loci under selection.
Individual loci are represented by dots. Loci are expected to be under positive selection if they are embedded within
the red area (higher differentiation than expected by chance), under neutral selection if they are in the grey area and
under balancing selection in case they are in the yellow area. Limits of the grey area correspond to the 95%
confidence interval thresholds of neutral expectations. Note that some markers have the same FST and He, and thus
appear overlapped in the graphs
CARDEDEU
MARTORELL
CERVELLÓ

APPENDIX B
149

APPENDIX C
149
APPENDIX C
Table C.1. Population details of 18 C. elephas and C. glandium populations.
Site Forest Type ID code Latitude ( ̊ N) Longitude ( ̊ E)
B_INF INF 1 41.5043 1.8410
B_CNF CNF 2 41.5070 1.8403
B_OF OF 3 41.5032 1.8386
C_INF INF 4 41.6296 2.3238
C_CNF CNF 5 41.6264 2.3403
C_OF OF 6 41.6305 2.3267
H_INF INF 7 41.5617 2.2892
H_CNF CNF 8 41.5678 2.2856
H_OF OF 9 41.5654 2.2842
I_INF INF 10 41.6596 2.2411
I_CNF CNF 11 41.6755 2.2183
I_OF OF 12 41.6739 2.2184
M_INF INF 13 41.4857 1.9017
M_CNF CNF 14 41.4716 1.8908
M_OF OF 15 41.4699 1.8898
V_INF INF 16 41.4639 2.0327
V_CNF CNF 17 41.4593 2.0299
V_OF OF 18 41.4604 2.0313

APPENDIX C
150
Table C.2. Linear mixed model selection. Saturated models included fixed factors plus their second-degree interactions (depicted by asterisks). Factor reference level were set
to: C.elephas for species and old forest (OF) for forest. Significant t-values at α = 0.05 are shown in bold. R2 marginal (variability explained by fixed factors) and R
2
conditional (variability explained by both, fixed and random factors) are provided for each model.
Response Predictor Method Coefficient t P-value R2
marginal
R2
conditional
Fixed Random
Population size Full
model
· Site REML 0.369 0.369
Species C. glandium -10.333 -3.391 0.002 **
Forest CNF -2.000 -0.656 0.517
INF -3.333 -1.094 0.283
Species * Forest C. glandium * CNF 3.333 0.774 0.445
C. glandium * INF 4.667 1.083 0.287
Selected
model
· Site REML 0.360 0.360
Species C. glandium -7.667 -4.410 < 0.001
***
Forest CNF -0.333 -0.157 0.877
INF -1.000 -0.470 0.642
Haplotype
richness
Full
model
· Site REML 0.494 0.622
Population size -0.03124 -1.212 0.2379
Species C. glandium -0.71650 -2.121 0.0449 *
Forest CNF -1.09219 -2.426 0.0243 *
INF -1.08605 -2.523 0.0196 *
Population size *
Species
0.04738 2.716 0.0120 *
Population size *
Forest
CNF 0.04856 1.812 0.0844 .
Population size * INF 0.04220 1.657 0.1124
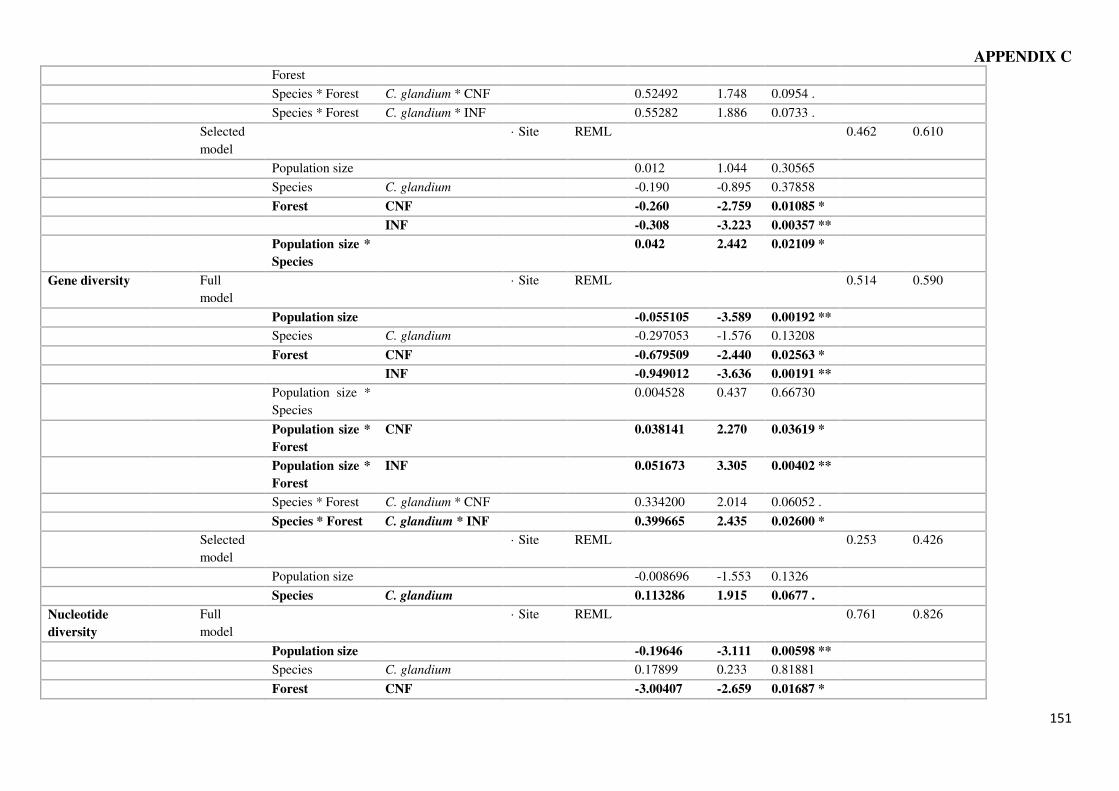
APPENDIX C
151
Forest
Species * Forest C. glandium * CNF 0.52492 1.748 0.0954 .
Species * Forest C. glandium * INF 0.55282 1.886 0.0733 .
Selected
model
· Site REML 0.462 0.610
Population size 0.012 1.044 0.30565
Species C. glandium -0.190 -0.895 0.37858
Forest CNF -0.260 -2.759 0.01085 *
INF -0.308 -3.223 0.00357 **
Population size *
Species
0.042 2.442 0.02109 *
Gene diversity Full
model
· Site REML 0.514 0.590
Population size -0.055105 -3.589 0.00192 **
Species C. glandium -0.297053 -1.576 0.13208
Forest CNF -0.679509 -2.440 0.02563 *
INF -0.949012 -3.636 0.00191 **
Population size *
Species
0.004528 0.437 0.66730
Population size *
Forest
CNF 0.038141 2.270 0.03619 *
Population size *
Forest
INF 0.051673 3.305 0.00402 **
Species * Forest C. glandium * CNF 0.334200 2.014 0.06052 .
Species * Forest C. glandium * INF 0.399665 2.435 0.02600 *
Selected
model
· Site REML 0.253 0.426
Population size -0.008696 -1.553 0.1326
Species C. glandium 0.113286 1.915 0.0677 .
Nucleotide
diversity
Full
model
· Site REML 0.761 0.826
Population size -0.19646 -3.111 0.00598 **
Species C. glandium 0.17899 0.233 0.81881
Forest CNF -3.00407 -2.659 0.01687 *

APPENDIX C
152
INF -3.40570 -3.208 0.00522 **
Population size *
Species
0.01886 0.445 0.66207
Population size *
Forest
CNF 0.17986 2.640 0.01758 *
Population size *
Forest
INF 0.19030 2.997 0.00826 **
Species * Forest C. glandium * CNF 1.38791 2.074 0.05500 .
Species * Forest C. glandium * INF 1.62787 2.447 0.02608 *
Selected
model
· Site REML 0.701 0.793
Population size -0.01337 -0.623 0.539
Species C. glandium 1.82555 8.113 3.08e-08
***
Gene flux
(population
pairwise FST)
COI Full
model
· Site REML 0.338 0.338
Forest pair OF - CNF -0.09283 -1.253 0.2239
CNF - INF -0.04682 -0.632 0.5342
Species C. glandium -0.17246 -1.901 0.0711 .
Forest pair *
Species
OF - CNF 0.16221 1.264 0.2200
CNF - INF -0.08601 -0.670 0.5099
Selected
model
· Site REML 0.251 0.251
Forest pair OF - CNF -0.03876 -0.616 0.5437
CNF - INF -0.07549 -1.201 0.2422
Species C. glandium -0.14706 -2.701 0.0128 *
SNP Full/Selec
ted model
· Site REML 0.189 0.478
Forest pair OF - CNF -1.312 0.2107
CNF - INF -0.00721 -2.480 0.0266

APPENDIX C
153
Table C.3. Population statistics for C. elephas and C. glandium for both mitochondrial and SNPs markers.
Mitochondrial marker
Population ID Species N r Gene diversity (H) Nucleotide diversity (πn)
1 C. elephas 9 3 0.556 ± 0.165 0.0018 ± 0.0015
C. glandium 5 3 0.700 ± 0.218 0.0079 ± 0.0055
2 C. elephas 9 3 0.639 ± 0.126 0.0013 ± 0.0012
C. glandium 5 4 0.900 ± 0.161 0.0066 ± 0.0047
3 C. elephas 12 7 0.909 ± 0.056 0.0027 ± 0.0022
C. glandium 6 5 0.933 ± 0.122 0.0396 ± 0.0237
4 C. elephas 10 2 0.467 ± 0.132 0.0007 ± 0.0008
C. glandium 3 3 NA NA
5 C. elephas 20 3 0.542 ± 0.105 0.0010 ± 0.0009
C. glandium 3 2 NA NA
6 C. elephas 18 4 0.556 ± 0.130 0.0011 ± 0.0010
C. glandium 3 4 NA NA
7 C. elephas 12 2 0.167 ± 0.134 0.0003 ± 0.0004
C. glandium 7 4 0.714 ± 0.181 0.0069 ± 0.0045
8 C. elephas 22 3 0.385 ± 0.113 0.0007 ± 0.0007
C. glandium 2 2 NA NA
9 C. elephas 14 4 0.736 ± 0.075 0.0016 ± 0.0012
C. glandium 12 4 0.636 ± 0.128 0.0019 ± 0.0015
10 C. elephas 21 4 0.586 ± 0.103 0.0014 ± 0.0011
C. glandium 6 3 0.714 ± 0.181 0.0065 ± 0.0043
11 C. elephas 11 3 0.691 ± 0.086 0.0014 ± 0.0012
C. glandium 14 7 0.788 ± 0.090 0.0105 ± 0.0061
12 C. elephas 17 5 0.647 ± 0.116 0.0013 ± 0.0011
C. glandium 10 6 0.778 ± 0.137 0.010044 ± 0.005988
13 C. elephas 6 4 0.867 ± 0.129 0.0020 ± 0.002
C. glandium 21 7 0.733 ± 0.068 0.0101 ± 0.0056
14 C. elephas 11 5 0.818 ± 0.083 0.0029 ± 0.0021
C. glandium 13 6 0.821 ± 0.082 0.0091 ± 0.0054
15 C. elephas 18 5 0.621 ± 0.120 0.0013± 0.0011
C. glandium 5 5 1.000 ± 0.127 0.0101 ± 0.0069
16 C. elephas 21 5 0.681 ± 0.072 0.0014 ± 0.0011
C. glandium 3 3 NA NA
17 C. elephas 14 5 0.659 ± 0.123 0.0016 ± 0.0014
C. glandium 8 3 0.679 ± 0.122 0.0128 ± 0.0077
18 C. elephas 20 4 0.363 ± 0.131 0.0008 ± 0.0008
C. glandium 1 1 NA NA

APPENDIX C
154
Table C.4. Pairwise population FST matrix for SNPs for SNP nuclear markers in C. elephas. Numbers refer to site code. INF: isolated new forest, CNF: connected new forest,
OF: old forest. Significant values are in bold.
1_INF 1_CNF 1_OF 2_INF 2_CNF 2_OF 3_INF 3_CNF 3_OF 4_INF 4_CNF 4_OF 5_INF 5_CNF 5_OF 6_INF 6_CNF 6_OF
1_INF 0.00000
1_CNF 0.00901 0.00000
1_OF 0.04467 0.04201 0.00000
2_INF 0.01047 0.01890 0.03991 0.00000
2_CNF -0.00041 0.00689 0.03605 0.00607 0.00000
2_OF 0.00478 0.01995 0.02790 0.01200 0.00429 0.00000
3_INF 0.01558 0.02399 0.02626 0.01344 0.01613 0.01061 0.00000
3_CNF 0.01176 0.02831 0.04339 0.01413 0.00692 0.01539 0.02304 0.00000
3_OF 0.00608 0.01573 0.03900 0.01951 0.00278 0.01470 0.02120 0.01053 0.00000
4_INF 0.00452 0.01731 0.03525 0.00555 0.00107 0.00271 0.01736 0.02013 0.00942 0.00000
4_CNF 0.01834 0.02461 0.03729 0.01260 0.00312 0.00710 0.01754 0.01389 0.01093 -0.01121 0.00000
4_OF 0.00239 0.02116 0.05005 0.01316 0.00331 0.01166 0.02286 0.02360 0.02370 0.01886 0.01904 0.00000
5_INF 0.00943 0.02244 0.03015 0.00616 0.00742 0.00339 0.01587 0.01756 0.01686 0.00186 0.01078 0.01221 0.00000
5_CNF 0.01823 0.03061 0.05977 0.01604 0.00723 0.01160 0.03023 0.01187 0.01099 0.00378 0.00810 0.01911 0.01188 0.00000
5_OF 0.02215 0.03056 0.07755 0.03438 0.01167 0.03253 0.05138 0.02618 0.02578 0.02767 0.02539 0.02599 0.03481 0.02062 0.00000
6_INF 0.00668 0.02482 0.03479 0.00851 0.00669 0.01596 0.03082 0.01012 0.01623 0.00786 0.01329 0.02044 0.01582 0.01672 0.02542 0.00000
6_CNF 0.00557 0.02298 0.01977 0.00869 0.00471 0.00577 0.01026 0.01270 0.01615 0.00824 0.01442 0.01983 0.00832 0.01665 0.02440 0.01336 0.00000
6_OF 0.00811 0.01479 0.01561 0.00882 0.00535 0.00725 0.01557 0.02004 0.00138 0.00170 0.00813 0.01800 0.00341 0.02013 0.03854 0.01360 0.00538 0.00000
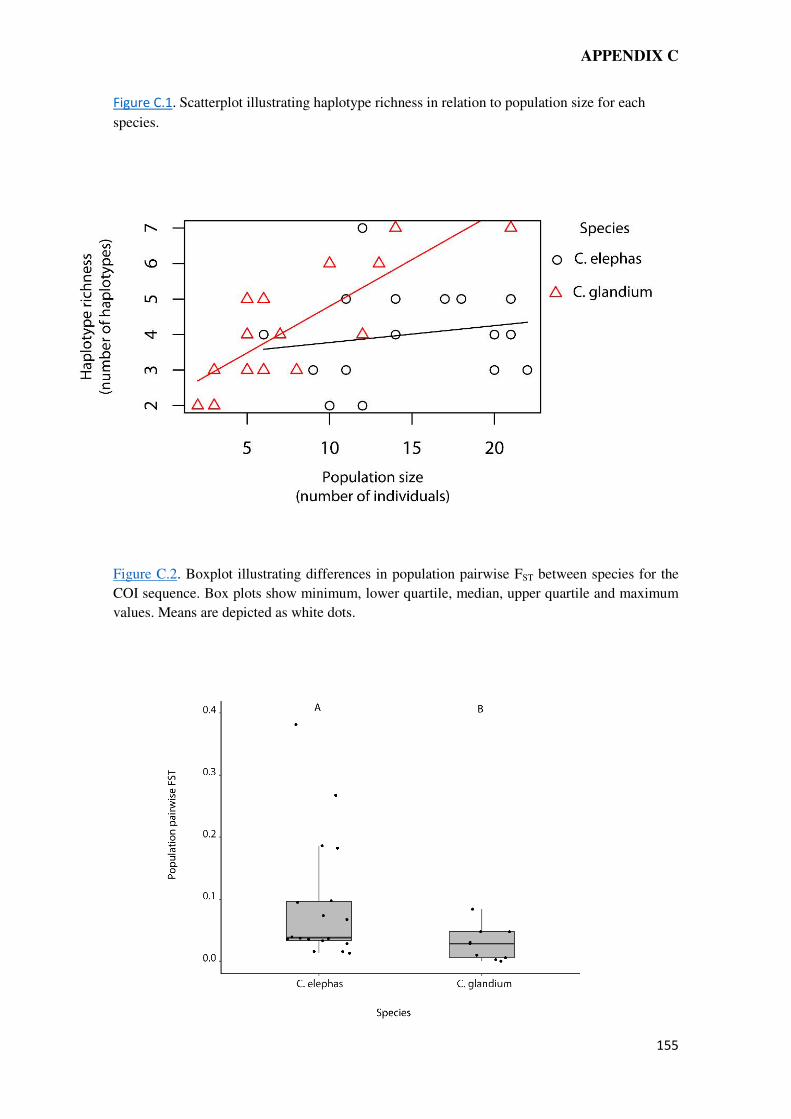
APPENDIX C
155
Figure C.1. Scatterplot illustrating haplotype richness in relation to population size for each
species.
Figure C.2. Boxplot illustrating differences in population pairwise FST between species for the
COI sequence. Box plots show minimum, lower quartile, median, upper quartile and maximum
values. Means are depicted as white dots.

APPENDIX C
156
Figure C.3. Boxplot illustrating differences in population pairwise FST between forest type for
SNPs. Box plots show minimum, lower quartile, median, upper quartile and maximum values.
Means are depicted as white dots.